Which FinTech business models are actually profitable?
Whether you're building or investing in the FinTech market, our report covers everything you need to know: the players, the money, and what's coming next.
Summary
Merchant payment infrastructure, vertical software plus payments and cross-border payments are the strongest profitable FinTech models today. Scaled digital banking and brokerage can produce even bigger absolute profits, but their earnings depend more heavily on rates, credit conditions or market activity.
The best FinTech economics generally appear when transaction volume can grow much faster than the capital and operating costs required to support it. That is why businesses moving money often look structurally stronger than businesses lending it.
Payments can work with surprisingly small take rates. Adyen converts roughly half of net revenue into EBITDA even though it keeps only a tiny fraction of the hundreds of billions of euros moving through its platform, while dLocal has continued growing profit despite a falling gross-profit yield on payment volume.
Cross-border payments show an unusually healthy version of the same dynamic. Wise lowered its average transfer take rate while volumes rose 31% and still generated a 26% pre-tax margin, meaning scale is allowing the company to charge customers less rather than forcing it to raise prices to protect profitability.
The strongest digital banks have moved far beyond the original neobank formula of free accounts and debit-card interchange. Nubank, Monzo and SoFi increasingly monetize the same customer through deposits, lending, subscriptions, payments, investing and other financial products.
BNPL has now proved that it can make real operating profit. Affirm and Klarna have both crossed that line, but their economics remain less durable than payment processing because every additional financing transaction also brings funding costs, underwriting risk and potential credit losses.
Consumer lending can be extremely profitable when underwriting works, but headline revenue is a poor way to judge it. Risk-adjusted margins, charge-offs and returns on equity tell us much more because bad loans can take months to reveal the real economics of a growth period.
Brokerage has become a much better business than the original zero-commission trading model suggested. Robinhood and Coinbase increasingly earn from interest, subscriptions, options, customer assets and other services, which reduces their dependence on any single trading category.
FinTech infrastructure software has attractive gross margins but a less automatic path to strong bottom-line profitability. Marqeta's 69% gross margin translated into only a 4% net margin in its latest quarter because engineering, compliance, product development and banking infrastructure still absorb a large share of gross profit.
Software plus payments is particularly attractive because the same customer relationship produces both recurring software revenue and transaction revenue. Toast's roughly even split between SaaS and payments recurring revenue shows why embedded payments become much more powerful when they sit inside software customers use every day.
The dividing line is ultimately how much extra financial risk a company needs to take to keep growing. The best FinTech businesses increasingly resemble financial toll roads: they can process another payment, move another dollar or sell another software module without needing anything close to the same amount of additional balance-sheet capital.

Written by the New Market Pitch teamWe track new markets so founders and investors can move faster. About us

A good product starts with a real problem. In our report covering the fintech market, we show you the ones customers still live with.
What does “profitable FinTech” actually mean today?
A genuinely profitable FinTech makes money after customer acquisition, fraud, funding costs, credit losses, compliance and stock compensation are taken into account, and it can keep doing so without needing unusually favorable market conditions.
That definition sounds obvious, but it rules out quite a few misleading examples. FinTech companies can produce a positive quarter because interest rates are high, trading activity suddenly jumps, a tax benefit appears or a large investment gain runs through the income statement. None of those automatically tells us whether the underlying business works.
Affirm is a good example. It finished fiscal 2026 with $1.93 billion of net income, but that number was heavily lifted by tax effects. The cleaner figure is operating income: $417 million for the year, compared with an $87 million operating loss a year earlier. Something meaningful changed in the core business.
We therefore care more about recurring operating profit, free cash flow and returns on capital than a single headline net-income number. We also have to distinguish businesses that earn fees from companies that put their own balance sheet at risk. A payment processor can earn a fraction of a percent on enormous volumes without funding the customer's purchase. A lender may earn several times more revenue per transaction, but defaults and funding costs come with it.
The strongest FinTech model is one that keeps making more money as transaction volume grows without requiring the company to take proportionally more financial risk.
Which FinTech business models are actually profitable today?
Payments, cross-border money movement, scaled digital banking, brokerage and software-plus-payments are clearly profitable FinTech models today, while BNPL and consumer lending can also work but produce less predictable economics.
The latest results across the sector make that split fairly easy to see. Adyen generated €641.5 million of EBITDA from €1.30 billion of H1 2026 net revenue. Wise generated $660 million of pre-tax income in FY2026. Nubank recently passed $1 billion of quarterly net income for the first time. Robinhood produced $573 million of quarterly net income, while Toast reached $154 million.
These businesses earn money in quite different ways, but the best ones share a few characteristics. They sit inside financial activity that happens repeatedly, their infrastructure can handle much more volume without costs rising at the same pace, and they usually have several ways to monetize the same customer.
Credit-heavy models are improving as well. Affirm moved decisively into operating profit during fiscal 2026, and Klarna's latest quarter produced $27 million of operating income after a $46 million loss a year earlier. The economics are simply more sensitive to funding and credit conditions.
| FinTech business model | Profitability today | Quality of the economics | Main weakness |
|---|---|---|---|
| Merchant payment processing | Very strong | Excellent | Pricing pressure |
| Vertical software + payments | Very strong | Excellent | Concentration in one industry |
| Cross-border payments | Very strong | Excellent | Falling take rates |
| Scaled digital banking | Very strong | Strong | Credit and rate exposure |
| Brokerage and investing | Very strong currently | Strong | Market cycles |
| Card issuing / FinTech infrastructure | Improving | Strong at scale | High fixed costs and customer concentration |
| BNPL | Proven at the leaders | Moderate | Funding and credit losses |
| Consumer lending | Proven | Moderate | Credit-cycle exposure |
| Basic interchange-led neobanking | Much weaker | Weak to moderate | Thin revenue per customer |
If you want more recent data on this point, please see our latest FinTech market report.

If you build or invest in the fintech market, you need to know which business models pay off now and which ones are fading. That's why our report covering it has a whole section on it.
Why are payment processors so profitable?
Large payment processors are among the most profitable FinTech businesses because tiny fees become enormous revenue pools once hundreds of billions of dollars move through largely fixed infrastructure.
Adyen shows the model particularly well. Its latest half-year results showed €803.8 billion of processed volume, up 24% year over year. That produced €1.30 billion of net revenue and €641.5 million of EBITDA. The EBITDA margin reached 49%, or 50% after removing one-time transaction costs, while free-cash-flow conversion was 86%.
Those numbers tell us more when we put them together. Adyen keeps only a very small slice of the money it processes, yet the platform is profitable enough to turn roughly half of net revenue into EBITDA. Once the network, licenses, engineering, fraud systems and merchant integrations exist, handling additional transactions is relatively cheap.
PayPal gives us a useful comparison at a more mature stage. Its latest quarter included $486.4 billion of payment volume, $8.68 billion of revenue and $1.43 billion of operating income. PayPal still makes a lot of money, although its 16.4% operating margin was down from 18.1% a year earlier while active accounts were almost flat.
dLocal shows what the same model looks like in emerging markets. It processed $17.7 billion during its latest quarter, up 92% year over year, while net income reached $54.8 million. Its gross profit represented only 0.72% of payment volume, compared with 1.07% a year earlier. Despite that compression, operating profit still grew 15%.
That is the attraction of payment infrastructure: take rates can fall while profit keeps rising if transaction growth is fast enough and operating costs grow more slowly.
Is cross-border payments one of the best FinTech businesses?
Cross-border payments are currently one of the best FinTech businesses because customers have a clear reason to pay, transaction values are meaningful and digital infrastructure can remove several expensive layers from traditional international banking.
Wise processed $243.5 billion across borders in FY2026, up 31%, while its average cross-border take rate fell from 0.58% to 0.52%. Despite charging less on each dollar transferred, Wise generated $2.5 billion of net revenue and $660 million of income before tax, giving it a 26% pre-tax margin.
The falling price is actually one of the more interesting parts of the story. Wise has been able to make transfers cheaper while increasing profit because customer numbers and transaction volume are growing faster than the price reduction. Customers are also using Wise for more than transfers: they held $39 billion through Wise accounts and spent $44 billion on Wise cards during the year.
Remittance specialist Remitly shows a similar progression on the consumer side. Its transaction volumes and revenue have continued growing while adjusted EBITDA has expanded much faster, which tells us that the company is spreading fixed technology, compliance and support costs across a larger payment base.
dLocal reaches the same conclusion from another direction. Its latest 92% increase in payment volume came with a much smaller 29% increase in gross profit because larger merchants and local-to-local transactions carry lower yields. The company still produced a 14% net margin. Scale is compensating for lower economics on each individual dollar processed.
Cross-border FinTech companies therefore have room to cut prices and still improve profits. That is a much healthier position than a model that needs higher fees every year just to maintain its margins.
If you want more recent data on this point, please see our latest FinTech market report.

Learning from others' mistakes is the cheapest lesson there is. In our market report about fintech companies, we look at what broke startups before you, so you don't repeat it.
Are digital banks actually profitable now?
The best digital banks are highly profitable now, and the winners have become full financial platforms rather than apps built around a free debit card.
Nubank has taken this furthest. The company now serves 139 million customers and recently generated $1.1 billion of quarterly net income, up 49% year over year. Return on equity reached 33%, while average monthly revenue per active customer was around $17.
The revenue mix explains why Nubank works. Credit contributed 41% of quarterly gross profit, float generated 34%, and fees provided 25%. A customer who originally arrived for a card can eventually generate lending income, deposit income and fee revenue.
Monzo has reached the same stage in the UK. FY2026 revenue rose 39% to £1.7 billion, gross profit reached £1.0 billion and adjusted pre-tax profit climbed to £172.6 million. Deposits increased 55% to £25.7 billion, while card spending reached £73 billion. Its revenue now comes from account balances, borrowing, payments, wealth, subscriptions and other fees.
SoFi provides a third example. Its latest quarter brought record net revenue of about $1.2 billion and $157 million of net income. SoFi started with student loans but has expanded across deposits, lending, investing and financial infrastructure.
This is also why basic interchange-led neobanking remains much less attractive. Interchange from card spending can help acquire and engage customers, but it usually leaves too little revenue after card costs, rewards, fraud, support and compliance. The profitable digital banks these days make much more money from the broader financial relationship.
Can BNPL actually be profitable?
BNPL is clearly capable of producing real profits now, although its economics remain more fragile than payments because every financing transaction brings funding and credit risk with it.
Affirm provides the strongest evidence. Fiscal 2026 GMV reached $50.2 billion, up from $36.7 billion the year before, while revenue rose to $4.26 billion. More importantly, operating income moved from an $87 million loss to a $417 million profit. Revenue less transaction costs reached $2.09 billion.
That turnaround is large enough to rule out the old idea that BNPL simply cannot make money. Affirm processed 194.5 million transactions during the year and reached 27.8 million active consumers. Transaction costs also fell from 4.8% of GMV to 4.3%, giving the company more room on each dollar of volume.
Klarna has now crossed the same line. Its latest quarterly GMV reached $36.6 billion and revenue reached $1.04 billion. Operating income was $27 million, compared with a $46 million loss a year earlier, while adjusted operating income reached $91 million.
The harder part is keeping those profits when credit conditions deteriorate. BNPL companies have to pay for financing, absorb defaults and continuously adjust underwriting. Payments companies face fraud and transaction losses too, but the balance-sheet exposure is much smaller.
So BNPL has proved that it can be profitable. We would still rank its profits below payment-processing profits in durability.

When you build or invest in the fintech market, you need clarity, not confusion. In our document detailing everything you need to know about fintech, we always try to put numbers on and quantify whatever is usually vague and confusing.
Can consumer lending produce durable FinTech profits?
Consumer lending can produce very good FinTech profits, but the model only deserves high marks when returns remain strong after defaults and funding costs.
Nubank gives us an unusually clear view of that equation. Its credit portfolio reached $39.4 billion in the latest quarter, while net interest income reached $3.7 billion. Credit costs were about $1.7 billion, leaving a risk-adjusted net interest margin of 12.4%.
The 12.4% figure is much more useful than the raw lending revenue. It tells us what remains after allowing for credit losses, and it was strong enough to support the company's 33% return on equity.
LendingClub provides a more traditional lending benchmark. Its recent results showed a net interest margin above 6%, return on equity around 15% and annualized net charge-offs on held-for-investment loans around 3%. Those economics are perfectly viable, but they also show how much more balance-sheet management lending requires.
A payment processor normally knows immediately whether a transaction generated revenue. A lender can book a loan today and discover months later that the original underwriting assumptions were too optimistic.
That lag makes aggressive growth much harder to judge. Rapid loan growth can create excellent future profit or hide future losses. For lending businesses, we care much more about risk-adjusted margins, delinquency trends and returns on equity than headline loan origination growth.
If you want more recent data on this point, please see our latest FinTech market report.
Why are brokerage apps so profitable right now?
Large brokerage apps are extremely profitable right now because one customer account can generate trading fees, options revenue, interest income, subscriptions, securities lending and other financial revenue at the same time.
Robinhood produced $1.31 billion of revenue and $573 million of net income in its latest quarter. Net income included a $129 million gain linked mainly to the deconsolidation of Robinhood Ventures Fund I, so the headline margin overstates the recurring level, but the underlying business was still highly profitable.
The revenue mix is more interesting than the total. Options generated $342 million, net interest revenue $389 million, event contracts $156 million, equities $129 million and crypto $100 million. Robinhood says 13 separate business lines have now reached at least $100 million in annualized revenue.
That diversification makes the company far stronger than the original zero-commission stock-trading model. When crypto revenue fell 38% year over year in the latest quarter, equity revenue nearly doubled and event-contract revenue increased more than tenfold. One weak trading category was absorbed by growth elsewhere.
Coinbase is making a similar transition. Subscription and services revenue has risen from just $6 million in Q2 2020 to $555 million in its latest reported quarter and now represents 48% of net revenue. Coinbase says 88% of current net revenue comes from activities outside Bitcoin spot trading.
Brokerage profits still move with market activity and interest rates, so they will never be as predictable as a mature SaaS subscription. The model becomes much sturdier once a company can earn from customer assets even when those customers are trading less.

In our report covering the fintech market, we look at what the winners do differently, so you can learn from the best instead of guessing.
Does FinTech infrastructure software really make money at scale?
FinTech infrastructure software can make good money at scale, but the current results show that high gross margins alone are nowhere near enough.
Marqeta processed $120 billion in its latest quarter, up 32% year over year. Net revenue reached $176 million and gross profit reached $122 million, giving the company a 69% gross margin. Yet net income was only $8 million, a 4% net margin.
The gap comes from the cost of running the platform. Operating expenses were about $118 million during the quarter. Engineering, compliance, bank partnerships, sales and product development still consume most of the gross profit even after Marqeta has reached enormous processing volume.
There is progress, though. Gross profit grew 17% while operating expenses grew only 4%, and the latest period was Marqeta's second consecutive quarter of GAAP profitability. Adjusted EBITDA reached $37 million, up 31%.
Flywire sits slightly earlier on the same curve. Its latest quarter produced $167.7 million of revenue on $8.2 billion of payment volume. Adjusted EBITDA rose 45% to $24 million, but the company still recorded an $8.1 million GAAP net loss.
FinTech infrastructure starts looking powerful once gross profit grows materially faster than the people and systems required to support it. Until then, a beautiful gross margin can hide a fairly ordinary bottom line.
Why does software plus payments work so well in FinTech?
Combining software with payments is one of the strongest FinTech models currently because customers pay for the software and then create another revenue stream every time money moves through it.
Toast shows how far that can go. The company now serves roughly 180,000 locations, and its latest quarter included $60.7 billion of gross payment volume. Annualized recurring run rate reached $2.4 billion, up 25%, while net income almost doubled year over year to $154 million.
Its $2.4 billion recurring run rate is split almost evenly between subscription and payment economics. SaaS ARR was around $1.2 billion, while payments ARR was also around $1.2 billion.
That combination changes the customer relationship. Restaurants use Toast for operational software, point-of-sale workflows and other day-to-day functions, while the same system handles their payments. Replacing the payment processor alone is relatively simple. Replacing software embedded across ordering, staff workflows, reporting, hardware and payments creates much more disruption.
The model also gives Toast more products to sell without acquiring the restaurant again. New software modules, financial products and payment features can all be distributed into an existing installed base.
Vertical software companies therefore get two useful economics at once: recurring subscription revenue and transaction revenue that rises with their customers' sales.
If you want more recent data on this point, please see our latest FinTech market report.

Your time is limited. In our research about fintech companies, we put numbers on each part of the market, so you can see where it makes sense to focus.
Have higher interest rates made FinTech profits look better than they really are?
Higher interest income has boosted profits across digital banking, brokerage and money-transfer platforms, so some current FinTech margins would be lower in a very different rate environment.
Wise makes the effect easy to see. Almost half of FY2026 net revenue came from activities outside traditional cross-border revenue, including net interest income, card revenue and other services. Customers were holding $39 billion through Wise accounts, creating a substantial pool of interest-bearing balances.
Robinhood earned $389 million of net interest revenue in its latest quarter, almost 30% of total revenue. The company also said that lower short-term interest rates partly offset growth in interest-earning assets, giving us direct evidence that rate changes are already affecting this revenue stream.
Digital banks benefit from the same mechanism because deposits can be invested or used to fund lending. That helped make the last few years especially favorable for companies with large customer cash balances.
We should therefore discount some of the spectacular margins in balance-heavy FinTech when judging how durable they are.
Payment businesses give us a useful control group. Their strongest profits come mainly from transactions rather than the yield on customer cash. Adyen's roughly 50% EBITDA margin in its latest half-year results shows that a FinTech company can still produce excellent economics without relying heavily on an interest-rate spread.
Which FinTech business models still struggle most?
FinTech models struggle most when they combine expensive customer acquisition with weak revenue per customer, or when a large balance-sheet risk is needed to make thin unit economics look attractive.
The basic free-neobank model is the easiest example. A company can attract millions of accounts with a free debit card and still have a weak business if those users keep little money in the account, borrow nothing, pay no subscription and generate only modest interchange.
Small infrastructure providers can run into a different problem. They may have attractive gross margins but too little revenue to cover the fixed cost of engineering, regulation, sales and banking relationships. Flywire's latest $8.1 million GAAP loss despite 27% revenue growth shows that fast growth and actual profitability can remain separated for quite a while.
Lending adds another failure mode. Weak underwriting can look harmless while loans are new because defaults arrive later. A lender can therefore grow revenue and originations rapidly before the full cost of that growth becomes visible.
The common thread is poor leverage on the customer relationship. Strong FinTech companies tend to acquire a customer once and then earn from repeated transactions, balances, software, subscriptions or additional financial products. The weakest ones repeatedly spend money acquiring users whose lifetime revenue never becomes large enough.

In our market report about fintech companies, we always try to gather several sources and make estimates that make sense, so you can work with solid numbers.
So which FinTech business model is actually the best?
Merchant payment infrastructure and software-plus-payments have the best FinTech economics today, with cross-border payments close behind; scaled digital banking and brokerage can generate even larger profits, but those earnings carry more financial-cycle risk.
Payment processors sit in the strongest position because the underlying transaction happens whether financial markets are exciting or boring. They collect a small amount on huge volumes, and mature platforms can add fraud tools, billing, treasury, issuing and other services around the same flow of money.
Software-plus-payments improves the formula further in markets where operational software creates real switching costs. Toast has already turned that combination into $2.4 billion of annualized recurring revenue while remaining profitable.
Cross-border payments deserve almost the same ranking. Wise managed to cut its average transfer take rate while processing 31% more volume and still producing a 26% pre-tax margin. That is the sort of price-versus-scale relationship we want to see in a durable FinTech model.
Digital banks can reach spectacular profitability once enough customers use them as their primary financial account. Brokerage platforms can do the same once deposits, subscriptions and multiple asset classes sit around the trading product. Both categories remain more exposed to rates, asset prices or credit conditions.
BNPL and lending have now proved they can make real money as well. Their position lower in the ranking comes from the extra things that can go wrong: funding becomes expensive, delinquencies rise or underwriting mistakes take months to appear.
The clearest dividing line across FinTech today is how much extra risk the company must take when it wants to grow. The most attractive models can process another billion dollars, sell another software module or move another payment without putting anything close to another billion dollars of their own capital at risk.
That is why the best FinTech businesses increasingly look like financial toll roads: they sit inside activity that already needs to happen, charge a small amount every time it does, and make the infrastructure more valuable as more customers use it.
| Rank | FinTech business model | Profit potential | Why it ranks here |
|---|---|---|---|
| 1 | Merchant payment infrastructure | Excellent | Massive recurring volume with limited balance-sheet risk |
| 2 | Vertical software + payments | Excellent | Subscription revenue, transaction revenue and high switching costs |
| 3 | Cross-border payments | Excellent | Strong customer need and powerful scale economics |
| 4 | Scaled digital banking | Very strong | Several revenue streams from one primary financial relationship |
| 5 | Brokerage and investing platforms | Very strong | Multiple high-margin ways to monetize assets and activity |
| 6 | FinTech infrastructure APIs | Strong at scale | High gross margins once fixed costs are absorbed |
| 7 | BNPL | Proven but less durable | Good transaction economics with meaningful credit and funding risk |
| 8 | Consumer lending | Profitable but capital-heavy | Attractive spreads offset by defaults and funding requirements |
| 9 | Basic interchange-led neobanking | Weakest | Too little monetization unless broader financial products are added |
If you want more recent data on this point, please see our latest FinTech market report.
Our methodology
The central question, which FinTech business models are genuinely the most profitable, is harder to answer than it first appears. Different models generate profit in very different ways, so instead of relying on headline margins or broad impressions, we broke the question into the economic dimensions that most directly determine whether a FinTech business actually gets stronger as it scales.
We reviewed recent evidence across payments, cross-border money movement, digital banking, brokerage, lending, BNPL, financial infrastructure and software-plus-payments. For each model, we aggregated the indicators that best reveal the underlying economics: operating profitability and cash generation, transaction or payment volume, monetization per customer or transaction, operating leverage, credit and funding exposure, balance-sheet intensity, revenue diversification, and sensitivity to interest rates or market activity.
The comparison was made at the business-model level rather than by simply ranking individual companies by reported margins. Large, scaled operators show what the economics can look like once fixed costs have been absorbed, while companies still moving through the profitability curve help reveal where high gross margins, strong growth or large transaction volumes have not yet translated into equally strong bottom-line profits.
We also treated the quality of profit as important. A model that can process substantially more volume through existing infrastructure is economically different from one where growth requires proportionally more lending capital, funding or credit exposure. That distinction is one of the main reasons payments and software-plus-payments rank above lending-heavy models even when lenders can report very strong returns.
Where current conditions can temporarily improve reported profitability, we looked past the headline number. Interest income, unusually active trading markets, tax benefits and investment gains can all make a quarter look stronger without permanently changing the underlying business, so operating profit, free cash flow, risk-adjusted returns and revenue composition were used when they gave a cleaner picture.
The final ranking aggregates those dimensions rather than allowing a single company, margin or quarter to determine the answer. The goal is to identify the FinTech models whose recent results show the strongest combination of proven profitability, recurring monetization, scalability and resilience as volume grows.
We prioritized company financial releases, shareholder materials, regulatory filings and other first-hand financial disclosures. Key sources include Affirm's fiscal 2026 results, Adyen's H1 2026 results, Wise's FY2026 results, PayPal's Q2 2026 earnings release, dLocal's Q2 2026 results, Remitly's Q2 2026 results, and Nubank's Q2 2026 results.
Additional primary sources used to compare banking, brokerage, lending and infrastructure economics include Monzo's 2026 annual report, SoFi investor releases, Robinhood's Q2 2026 results, Coinbase's Q2 2026 results, Klarna's Q2 2026 results, LendingClub / Happen's Q2 2026 results, Marqeta's Q2 2026 results, Flywire's Q2 2026 results, and Toast's investor materials.

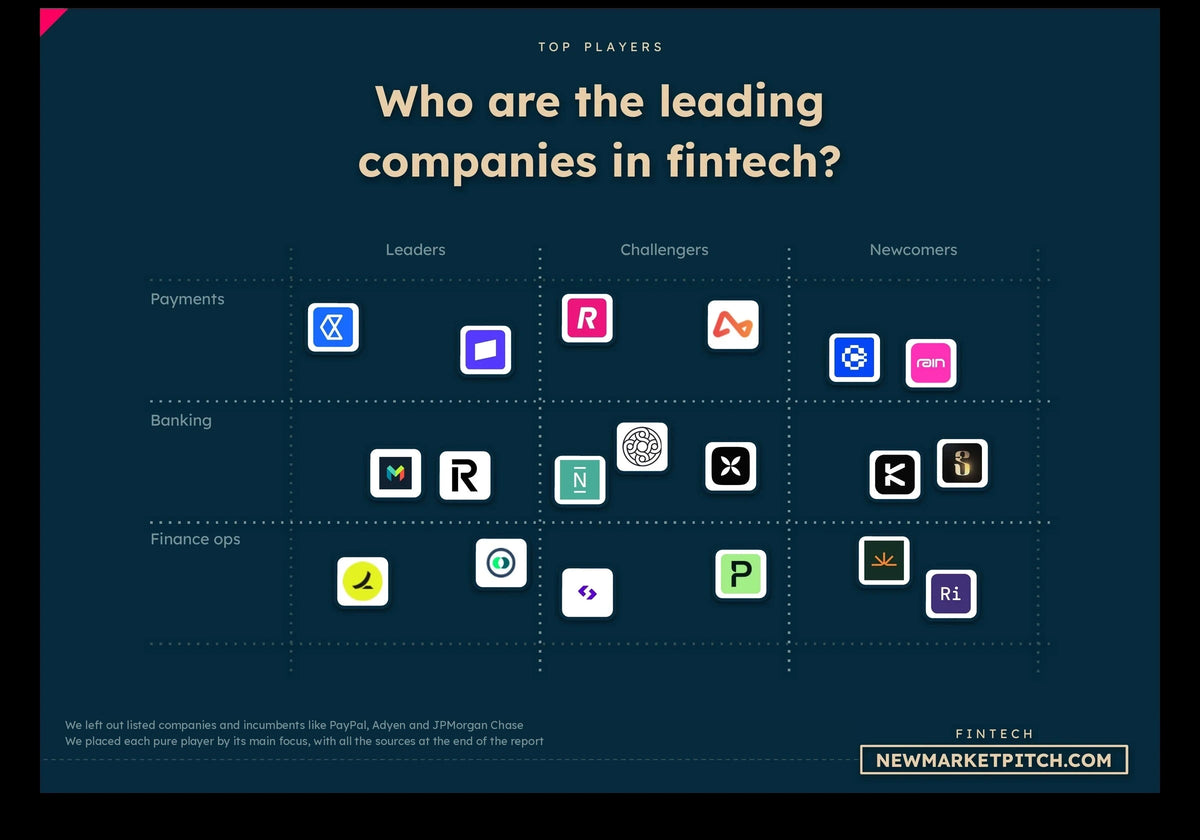
In our document detailing everything you need to know about fintech, we turn what is vague and complex into simple, useful visuals. Market maps like this one show you at a glance where every startup stands.
Written by the New Market Pitch teamWe track new markets so founders and investors can move faster. About us