Do grid batteries still make money?
Whether you're building or investing in the grid-scale battery storage market, our report covers everything you need to know: the players, the money, and what's coming next.
Summary
Yes, grid batteries still make money, but profitability now depends heavily on location, contracts, and construction costs. The best opportunities are increasingly found in contracted storage projects and selected electricity markets, while merchant batteries in saturated markets face much weaker returns.
The industry's expansion is masking a deterioration in earnings per battery. U.S. utility-scale battery capacity reached 43.6 GW at the end of 2025 and approached 52 GW by mid-2026, even as revenue per installed kilowatt fell sharply in some major markets.
Texas illustrates how quickly a booming market can become financially difficult. Average merchant battery revenues fell from approximately $193/kW in 2023 to $29.4/kW in 2025, an 85% decline. At that level, a new battery costing $75 million could need more than 25 years to recover its construction cost from gross revenue alone.
Batteries are undermining some of their own trading opportunities. As more systems enter the grid, competition drives down frequency-service prices, while simultaneous charging and discharging can compress the electricity-price differences that make arbitrage profitable.
California demonstrates why wholesale revenue tells only part of the story. Its batteries earned roughly $40/kW from wholesale activities in 2025, but estimated total revenue could reach $178/kW when Resource Adequacy payments are included. The economics change dramatically when capacity contracts are counted.
PJM currently offers a much more lucrative, but less proven, opportunity. Following changes to its regulation market, benchmark battery revenues reached approximately $62/kW per month, equivalent to $744/kW annually if sustained. Those exceptional earnings should not be treated as a dependable fifteen-year forecast.
Great Britain and Australia show that the shift toward energy arbitrage is broader than the United States. Solar generation, changing grid conditions, and electricity-price volatility create valuable trading opportunities, but higher storage penetration can gradually erode those opportunities too.
Cheaper battery equipment helps, but falling costs do not automatically compensate for collapsing revenues. Under a simplified fifteen-year investment model, a battery costing $1,000/kW needs approximately $151.50/kW in annual revenue, while even a $500/kW installation needs around $85.80/kW.
The more dependable ownership model combines competitive construction costs with long-term capacity or tolling agreements. Four-hour batteries can also command greater value where extended capacity is needed, although additional storage duration brings higher costs and does not guarantee proportionally higher revenue.
Equipment suppliers have a different profit opportunity from battery owners. Tesla's energy generation and storage business earned approximately $3.80 billion in gross profit in 2025, even as merchant storage revenues weakened in Texas and California. Grid storage remains an attractive industry, but the easy money from simply installing another battery is disappearing.

Written by the New Market Pitch teamWe track new markets so founders and investors can move faster. About us
Why are grid batteries booming when their revenues are falling?
Grid batteries are being installed faster than ever, even though the money an individual battery can earn has dropped sharply in some of the biggest electricity markets.
According to the U.S. Energy Information Administration, American utility-scale battery capacity reached 43.6 GW at the end of 2025, after growing at an average annual rate of approximately 70% over the preceding three years. Another 8.3 GW entered service in the first half of 2026, bringing the fleet to nearly 52 GW. Developers planned a further 14 GW for the second half of the year.
Yet Modo Energy's Texas revenue benchmark tells a very different story. Average battery market revenues dropped from approximately $193/kW in 2023 to $56/kW in 2024 and an estimated $29.4/kW in 2025. That is an 85% decline in two years.
These figures measure gross market revenue, before operating expenses and financing costs. Nevertheless, the contrast is striking: installed capacity is multiplying while revenue per installed kilowatt is shrinking.
Early projects could charge high prices for rapid grid services because relatively few competitors offered them. As more batteries connect to the grid, those services become cheaper, even as demand for storage continues to grow.
What does it actually mean for a grid battery to make money?
A grid battery can earn millions in electricity-market revenue and still fail to generate an acceptable return for its owner. We need to separate trading revenue, operating profit, and the return investors receive on the money they put into the project.
A battery earns money by buying electricity when prices are low and selling it when prices rise. It can also be paid to stabilize grid frequency, provide reserves, or remain available when the electricity system is under stress.
Those revenues must eventually cover electricity losses, maintenance, operating expenses, battery degradation, financing, and the original construction investment.
Consider a battery that costs $100 million and generates $8 million in annual revenue. If recurring expenses absorb $2 million, the remaining $6 million represents a 6% annual cash yield before major replacement costs and debt repayments. That may be disappointing for investors who took development, construction, and electricity-price risks.
A cheaper project with a long-term contract could earn less revenue but deliver a better return.
There is another distinction worth making. A battery manufacturer earns money by selling equipment, while a battery owner must recover its investment through years of electricity-market earnings.

A good product starts with a real problem. In our report covering the grid-scale battery storage market, we show you the ones customers still live with.
Have grid battery revenues really collapsed?
Grid battery revenues have fallen dramatically in Texas and California, but other electricity markets are still offering much better opportunities.
In Texas, Modo Energy estimated 2025 battery revenues at $29.4/kW, down from approximately $193/kW in 2023. California's wholesale battery revenues followed a similar, though less severe, path: roughly $80/kW in 2023, $51/kW in 2024, and $40/kW in 2025.
These were sustained declines across several years, rather than one particularly weak month.
Great Britain looks different. According to Modo Energy, a typical two-hour battery earned approximately £73,145/MW over the twelve months ending April 2026. Revenue remained meaningful, although monthly performance was uneven. In July 2026, annualized earnings fell to £63,000/MW, down 10% from June but still 14% above July 2025.
We also need to be careful about what these benchmarks include. Wholesale revenue does not necessarily capture capacity contracts or other privately negotiated payments. Comparing a merchant battery in Texas with a contracted project in California can therefore give a misleading picture of their relative profitability.
| Market benchmark | Earlier observation | Later observation | Change |
|---|---|---|---|
| Texas merchant, 2023–2024 | $193/kW-year | $56/kW-year | −71% |
| Texas merchant, 2024–2025 | $56/kW-year | $29.4/kW-year | −47% |
| Texas merchant, 2023–2025 | $193/kW-year | $29.4/kW-year | −85% |
| California wholesale, 2023–2024 | $80/kW-year | $51/kW-year | −36% |
| California wholesale, 2024–2025 | $51/kW-year | ~$40/kW-year | −22% |
| California wholesale, 2023–2025 | $80/kW-year | ~$40/kW-year | −50% |
| Great Britain, June–July 2026 | £70k/MW-year | £63k/MW-year | −10% |
| Great Britain, July 2025–July 2026 | ~£55k/MW-year | £63k/MW-year | +14% |
The GB figures are annualized monthly revenue rates, rather than full-year receipts. Texas and California figures refer to wholesale-market benchmarks and generally exclude privately negotiated capacity contracts.
Are grid batteries destroying their own profits by competing with each other?
Grid batteries are already pushing down the prices of the services that made early storage projects so profitable, particularly in Texas and California.
In Texas, Modo Energy found that roughly 9 GW of battery capacity entered ERCOT during 2024 and 2025. The installed fleet had grown approximately seventyfold since 2020, making batteries far more common in markets that once had very limited competition.
This changed where operators earned their money.
In June 2024, energy arbitrage represented approximately 25% of ERCOT battery revenues. By June 2025, it accounted for 76%. In California, arbitrage represented about 91% of wholesale battery revenue in June 2025.
Frequency regulation helps explain the shift. Electricity systems need a limited amount of rapid-response capacity to maintain grid stability. When relatively few batteries could provide it, prices were attractive. Once enough batteries entered those markets, operators had to compete for the same demand.
They increasingly turned toward buying cheap electricity and selling it during expensive hours.
Unfortunately, that business also becomes more competitive as batteries multiply. When thousands of megawatts charge during sunny afternoons, they increase electricity demand and can raise the cheapest prices. When those batteries discharge during the evening peak, they increase supply and can reduce the highest prices.
The gap between buying and selling prices narrows. Batteries are becoming victims of the very price stability they help create.
If you want more recent data on this point, please see our latest grid-scale battery storage market report.

If you build or invest in the grid-scale battery storage market, you need to know which business models pay off now and which ones are fading. That's why our report covering it has a whole section on it.
Are cheaper batteries enough to make grid storage profitable again?
Cheaper battery equipment is improving the economics of new grid storage projects, but prices have not fallen fast enough to offset the biggest revenue declines in saturated electricity markets.
BloombergNEF reported that average lithium-ion battery pack prices reached $108/kWh in 2025, down 8% from 2024. Its 2026 levelized-cost assessment also found that battery storage project costs had reached new lows.
That helps developers enormously. Lower equipment costs mean less money must be recovered through future electricity-market revenues.
However, a battery pack is only part of a completed installation. Projects also require inverters, transformers, safety systems, construction, land, grid connections, and development work. Some of those expenses can remain high even when battery cells become much cheaper.
Consider a simplified project costing $1,000/kW, with a 10% annual capital recovery charge and $20/kW in recurring costs. It would need approximately $120/kW annually to meet those assumptions.
Reducing construction costs by 25% would lower that requirement to roughly $95/kW.
That is a meaningful improvement, but still more than three times Texas's estimated $29.4/kW wholesale revenue in 2025.
The example is illustrative rather than a universal project-cost benchmark. It shows why construction-cost reductions cannot automatically rescue a market experiencing an 85% revenue decline.
Falling equipment prices also create an uncomfortable situation for older projects. New developers can purchase cheaper batteries, while existing owners remain tied to their original construction costs.
Can a grid battery still pay for itself in Texas?
A new Texas grid battery relying entirely on average wholesale-market revenues would struggle to pay for itself at 2025 earnings levels.
Modo Energy estimated ERCOT battery revenues at $29.4/kW in 2025. That translates to approximately $29,400 annually for each megawatt of installed battery power capacity.
For a 100 MW installation, the equivalent annual gross revenue would be about $2.94 million.
Suppose that battery costs $75 million to build. Gross revenue would represent just 3.9% of the initial investment, giving a simple payback period of more than 25 years before paying for operations, electricity losses, maintenance, or financing.
That's a poor starting point for a new project.
Actual project returns can differ considerably. Battery duration, the connection point on the electricity grid, the commissioning date, and the owner's trading strategy all affect earnings. The market benchmark also reflects a fleet containing many shorter-duration systems.
Weather explains part of the weakness. Modo Energy reported that Texas experienced far fewer extreme heat days in 2025, reducing the scarcity-price events that previously generated exceptional battery revenues.
But the company's analysis also found lower battery earnings than in previous years at comparable temperatures. Additional storage capacity has made competition much tougher.
If you want more recent data on this point, please see our latest grid-scale battery storage market report.

Learning from others' mistakes is the cheapest lesson there is. In our market report about grid batteries, we look at what broke startups before you, so you don't repeat it.
Are California grid batteries still profitable because of capacity contracts?
California grid batteries can still earn attractive returns because capacity contracts provide substantial revenue beyond what operators collect from wholesale electricity trading.
The main mechanism is Resource Adequacy. Electricity suppliers pay power plants and batteries to guarantee that enough capacity will be available when the grid needs it.
Modo Energy estimated that California's average battery could have earned approximately $178/kW in total annual revenue in 2025 when Resource Adequacy payments were included. Wholesale-market activities alone contributed roughly $40/kW.
That is more than four times as much revenue once capacity payments are counted.
For a 100 MW battery, the difference would be approximately $17.8 million in annual gross revenue instead of $4 million. Depending on construction costs, financing, and contract conditions, that can completely change whether the investment makes sense.
But the headline number should not be interpreted as guaranteed profit. Actual contracts vary by duration, price, available capacity, and penalties for failing to perform. Some owners also share electricity-trading revenue with their customers.
Competition is growing here too. According to Modo Energy, California reached approximately 15.7 GW of installed battery capacity at the end of 2025, after adding 4.7 GW during the year. In June 2026, the wholesale revenue benchmark fell to $2.55/kW-month, about 17% below the previous year.
Why are grid batteries making so much more money in PJM?
PJM grid batteries have recently earned far more than batteries in Texas because the regional electricity market pays much higher prices for certain grid services.
PJM operates across much of the U.S. Mid-Atlantic and parts of the Midwest. In October 2025, changes to its regulation market altered how fast-response resources were paid.
Modo Energy's May 2026 assessment found that benchmark battery revenues rose from approximately $20/kW-month before the redesign to $62/kW-month afterward. February 2026 reached $104.5/kW-month.
At $62/kW-month, the annualized revenue would be approximately $744/kW.
That is roughly 25 times Texas's estimated 2025 annual merchant revenue per kilowatt, although these benchmarks cover different periods, markets, and battery fleets.
The difference is remarkable considering that the same basic battery technology can operate in both regions.
PJM currently offers a particularly attractive opportunity because of its market rules and the relationship between grid-service demand and available battery capacity.
But anyone building a fifteen-year investment case around these recent revenues is taking a major gamble. Regulation services have limited demand, and exceptionally high payments encourage developers to install more batteries.
Texas experienced precisely that cycle. Early projects earned very high revenues from specialized grid services, more operators entered, and the original opportunities became less profitable.
If you want more recent data on this point, please see our latest grid-scale battery storage market report.

When you build or invest in the grid-scale battery storage market, you need clarity, not confusion. In our document detailing everything you need to know about grid-scale battery storage, we always try to put numbers on and quantify whatever is usually vague and confusing.
Are grid batteries still making good money in Australia?
Australian grid batteries are still finding valuable trading opportunities, largely because abundant solar electricity creates cheap daytime charging periods and higher-priced evening demand.
Australia's National Electricity Market has a high share of rooftop and utility-scale solar generation. Electricity prices can become very low or negative during sunny periods, giving batteries opportunities to charge cheaply before selling electricity later.
According to the Australian Energy Market Operator's first-quarter 2026 market data, energy arbitrage accounted for approximately 97% of battery revenue in the relevant market breakdown.
That shows how far the Australian market has moved away from the early days when frequency-control services accounted for much of battery income.
A similar shift has occurred in Texas and California, but Australia's large solar fleet gives it a particularly strong reason to need storage across different hours of the day.
Still, we cannot assume that every battery will earn attractive returns. When more storage enters the same region, competition increases for cheap daytime electricity and profitable evening sales.
AEMO's wholesale data confirms that battery trading has become an important part of Australia's electricity system. It does not establish whether the average project is earning enough to repay its investors.
Are four-hour grid batteries making more money than two-hour batteries?
Four-hour grid batteries can earn more revenue than two-hour batteries when electricity prices stay high for several hours or when utilities pay for longer periods of guaranteed power. But buying twice as much energy capacity does not automatically produce twice the profit.
A 100 MW battery with two hours of storage holds approximately 200 MWh. A four-hour installation holds 400 MWh, allowing it to deliver the same 100 MW of power for twice as long.
That extra duration is useful during extended evening demand peaks and for contracts requiring several hours of dependable capacity.
California has historically rewarded four-hour batteries through its Resource Adequacy framework. Texas, by contrast, attracted many shorter-duration projects because rapid frequency regulation and short price spikes offered attractive earnings without requiring large amounts of stored energy.
Modo Energy's 2026 analysis placed ERCOT's average battery duration at approximately 1.65 hours, compared with roughly 3.5 hours in California.
That difference reflects what each market has been willing to pay for.
As batteries rely more heavily on energy arbitrage and capacity payments, longer-duration systems become more interesting. But the first two hours of storage often capture the largest electricity-price differences. Additional hours can provide progressively smaller incremental revenue.
Longer batteries also cost more and require careful management of degradation. Over time, usable capacity declines, potentially making it harder to meet a four-hour contractual obligation. Owners may need to install additional modules or replace aging equipment.
Battery warranties can protect against some capacity shortfalls, but they do not necessarily compensate owners for lost trading opportunities, replacement labor, or downtime.

In our report covering the grid-scale battery storage market, we look at what the winners do differently, so you can learn from the best instead of guessing.
Can grid batteries make money without huge electricity-price spikes?
Grid batteries can remain profitable without extreme electricity-price spikes when they have stable capacity payments or other contracts. Batteries that depend entirely on merchant trading are much more exposed when those exceptional events disappear.
Texas shows how risky this dependence can become.
Modo Energy found that the 30 highest-revenue days accounted for between 44% and 68% of annual battery earnings in earlier years. In 2025, their contribution fell to approximately 30%.
Earlier projects could collect a large share of their annual revenue during a relatively small number of exceptional days. Operators now need to earn more consistently across ordinary trading periods.
Batteries themselves help reduce electricity-price spikes by providing power when the system is short of supply. As more are installed, short periods of extreme scarcity can become less severe.
Capacity payments offer an alternative. Utilities or electricity suppliers can pay battery operators to guarantee that capacity will be available when needed, regardless of whether extreme wholesale prices actually occur.
This model is particularly relevant in California and PJM.
Extreme price events will not disappear completely. Weather, transmission failures, unexpected power station outages, and changing electricity demand can still create valuable trading opportunities.
Do battery tolling agreements guarantee profits?
Battery tolling agreements can make grid storage projects much easier to finance by locking in predictable revenue, but the contract price still has to be high enough to cover construction, operating costs, and financing.
Under a typical tolling agreement, a utility or electricity trader pays for the right to control when a battery charges and discharges. The battery owner receives an agreed payment, while the customer takes much of the electricity-trading risk.
That arrangement can be particularly useful in markets where merchant revenues have become unpredictable.
A project with a ten- or fifteen-year tolling agreement can potentially secure debt financing on better terms than a battery depending entirely on future trading profits. Banks generally find predictable contract payments easier to assess than volatile electricity-price forecasts.
However, the customer signing the agreement still needs to make money from the battery's services. When wholesale revenue expectations weaken, new tolling prices may also fall.
Contract terms can create additional expenses. Battery owners may face availability requirements, performance guarantees, cycling restrictions, and penalties when equipment fails to deliver.
And the counterparty matters. A long-term agreement offers limited protection if the company responsible for making payments cannot honor it.

Your time is limited. In our research about grid batteries, we put numbers on each part of the market, so you can see where it makes sense to focus.
How much revenue does a grid battery need to break even?
A grid battery costing $1,000/kW would need approximately $151.50/kW in annual revenue under a simplified 15-year investment model with a 10% required return and $20/kW in recurring costs.
We can use that calculation to see how strongly construction costs affect the amount a battery must earn.
At an installed cost of $750/kW, the annual revenue requirement falls to approximately $118.60/kW. At $500/kW, it drops to roughly $85.80/kW.
These are calculated investment thresholds, rather than observed project profits. They assume a 15-year economic recovery period and use a capital recovery factor of approximately 13.15%.
They also exclude taxes, subsidies, detailed debt structures, and major equipment replacement costs. Actual financing models can produce very different requirements.
Even so, the comparison helps explain why the same battery technology can be profitable in one market and financially unattractive in another.
Texas's estimated $29.4/kW merchant revenue in 2025 would not cover the calculated annual requirement even for the cheapest project in this illustration. California's approximately $178/kW full-stack revenue benchmark would offer considerably more room to recover the investment.
PJM's recent regulation revenues would exceed these thresholds by a wide margin if they continued throughout an entire investment period. There is little reason to treat that continuation as a certainty.
| Illustrative project | Installed cost per kW | Annual recurring cost per kW | Required revenue per kW/year |
|---|---|---|---|
| Very low-cost installation | $500 | $20 | $85.8 |
| Lower-cost installation | $625 | $20 | $102.2 |
| Mid-low-cost installation | $750 | $20 | $118.6 |
| Mid-cost installation | $875 | $20 | $135.1 |
| Reference installation | $1,000 | $20 | $151.5 |
| Higher-cost installation | $1,125 | $20 | $167.9 |
| High-cost installation | $1,250 | $20 | $184.4 |
All scenarios use the same 15-year recovery period and 10% required return. Figures represent calculated revenue requirements rather than actual market prices.
If you want more recent data on this point, please see our latest grid-scale battery storage market report.
Are battery manufacturers making money while grid storage owners struggle?
Battery manufacturers can earn substantial profits from the storage boom even when the companies operating grid batteries face disappointing returns.
Tesla provides one of the clearest public examples.
According to its 2025 annual filing, Tesla's energy generation and storage business recorded approximately $12.77 billion in revenue and $3.80 billion in gross profit, giving it a gross margin of 29.8%.
In 2024, the same segment generated $2.64 billion in gross profit at a 26.2% margin.
Gross profit therefore increased by approximately 44% year over year, despite greater competition and lower average Megapack selling prices.
More recent results show that manufacturing margins are also under pressure. In the second quarter of 2026, Tesla's energy segment generated $3.14 billion in revenue and $640 million in gross profit, equivalent to a 20.4% gross margin. The comparable margin a year earlier was 30.3%.
Tesla's energy segment also includes Powerwall and other activities, so those figures should not be treated as Megapack-only results. Gross profit also comes before operating expenses.
Nevertheless, the business has demonstrated that supplying batteries can generate billions in gross profit while battery owners contend with much weaker electricity-market earnings.

In our market report about grid batteries, we always try to gather several sources and make estimates that make sense, so you can work with solid numbers.
Could grid batteries become victims of their own success?
Grid batteries are already reducing some of the price differences that made the first projects exceptionally profitable, but electricity systems still need more storage as renewable generation and power demand change.
The evidence from mature markets is strong. Texas has seen a sharp fall in merchant revenues as its battery fleet expanded. California has experienced a similar decline in wholesale earnings, although contracted revenues can still support project economics.
The effect comes from batteries doing exactly what they are designed to do: charging when electricity is abundant and releasing energy when supply is more constrained.
But new opportunities keep appearing.
Solar generation continues to produce cheap electricity during certain daytime hours. Conventional power stations are retiring in some regions. Transmission constraints can leave parts of the grid short of capacity even when other areas have surplus generation.
Electricity demand from data centers, factories, and electrification can also increase the need for dependable capacity, although the benefit to batteries depends heavily on when that demand occurs.
A data center consuming electricity at a fairly constant rate does not automatically make four-hour battery trading more profitable. By contrast, stronger evening demand alongside abundant midday solar generation can increase the value of moving electricity between those periods.
The EIA reported that U.S. developers planned approximately 24 GW of utility-scale battery additions in 2026, compared with around 15 GW installed in 2025. Texas, California, and Arizona accounted for roughly 80% of the planned capacity.
Developers clearly still see opportunities in those regions, despite the disappointing merchant revenue numbers. Whether those opportunities reward investors as well as developers expect is another question.
Which grid battery business model makes the most money today?
Contracted grid battery ownership currently offers a more dependable investment case than pure merchant trading in saturated markets, while equipment manufacturing can provide a separate source of substantial profits. The highest merchant returns are still available in selected markets, but they come with greater uncertainty.
Comparing the evidence across the industry makes the differences clear.
California shows the appeal of contracted revenue. Resource Adequacy payments can lift total battery earnings to several times what wholesale trading alone provides.
Texas shows how quickly merchant economics can deteriorate. The market's exceptional early revenues encouraged rapid development, but subsequent competition reduced earnings dramatically.
PJM demonstrates that extremely profitable trading opportunities still exist. Its recent regulation-market revenues have exceeded the benchmarks in many other regions, although assuming those returns will last would be a risky bet.
Tesla offers another route into the industry. Its energy business generated billions in gross profit from storage equipment and related products, even as some electricity markets became much more competitive for asset owners.
We would favor a well-contracted battery in a market with clear capacity needs over a merchant project whose investment case depends on the continuation of unusually high trading revenues.
If you want more recent data on this point, please see our latest grid-scale battery storage market report.

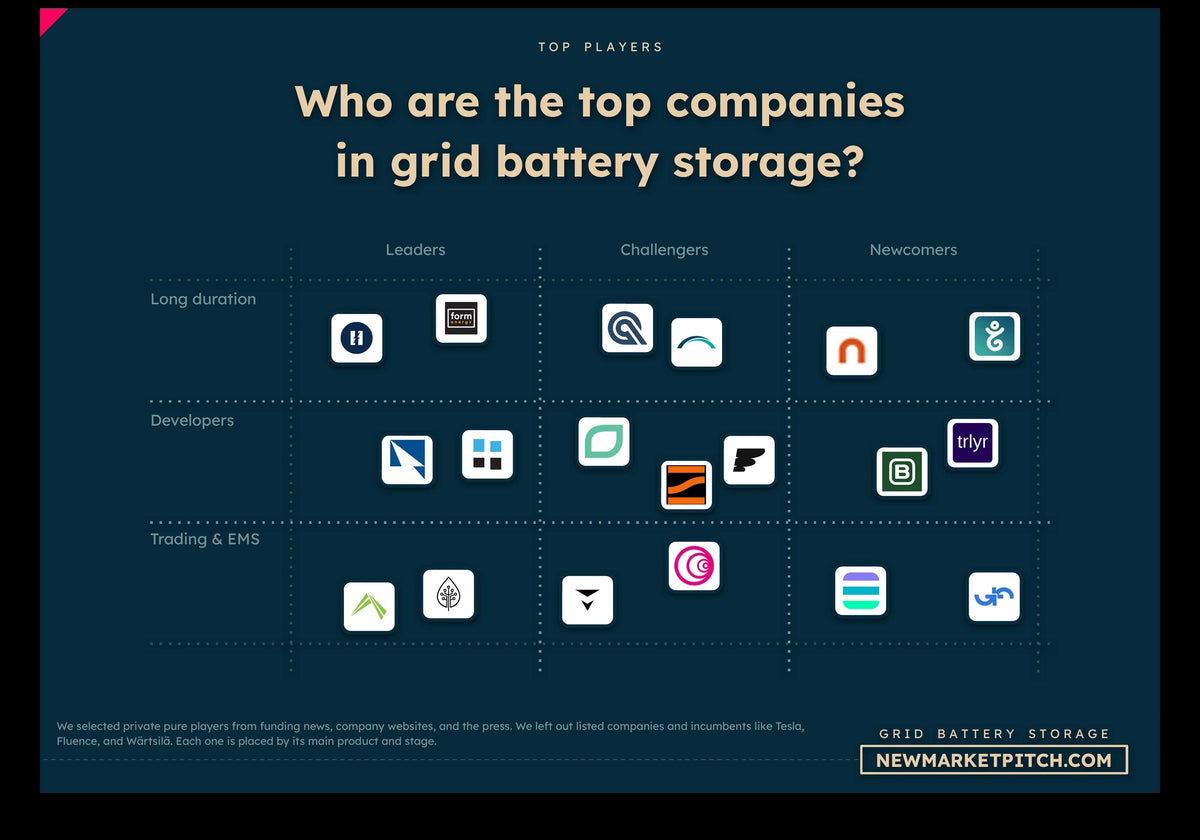
In our document detailing everything you need to know about grid-scale battery storage, we turn what is vague and complex into simple, useful visuals. Market maps like this one show you at a glance where every startup stands.
Do grid batteries still make money?
Yes, grid batteries still make money, but the period when early operators could earn extraordinary returns simply by installing storage is coming to an end in mature markets.
The biggest change is that deployment growth and project profitability are moving in different directions.
Texas provides the clearest warning, with merchant battery revenues down approximately 85% between 2023 and 2025. Those earnings are difficult to reconcile with the cost of building new projects without additional revenue sources.
California gives a more encouraging picture. Long-term capacity payments can support much higher total revenues than wholesale trading alone, making contracted storage a more credible infrastructure investment.
PJM shows that merchant opportunities can still produce exceptional returns where market conditions and regulation create favorable pricing. But Texas offers a reminder of what can happen when more competitors arrive.
At the same time, battery equipment has become cheaper, and manufacturers such as Tesla have demonstrated that the supply side of the industry can generate substantial gross profits.
Our conclusion is that the grid battery industry remains commercially attractive, although the economics have become much more selective. The best opportunities increasingly depend on contracts, location, construction costs, and disciplined operation.
Grid batteries are becoming a normal part of electricity infrastructure. That is good news for the technology and for the power system. For investors, however, it means that the easy money is disappearing, and simply building another battery is no longer enough to ensure an attractive return.
Sources and methodology
This analysis examines whether grid batteries remain commercially profitable despite rapid deployment and declining market revenues. We assess electricity-market earnings, regional competition, contractual revenue, battery construction costs, and manufacturer financial performance. Our central distinction is between revenue earned by a battery, the investment return available to its owner, and profits generated by companies supplying storage equipment.
We structured the research around deployment growth, revenue compression, competition between batteries, regional market design, financing, storage duration, and business-model economics. For each dimension, we collected recent observations, aggregated comparable figures, examined the drivers behind them, and assessed whether the combined evidence supported a stronger conclusion. The research primarily covers 2025 and 2026, with historical observations used to measure changes in revenue and market penetration.
Our geographic comparisons cover ERCOT in Texas, CAISO in California, PJM in the eastern United States, Great Britain, and Australia's National Electricity Market. We distinguish wholesale trading revenues from full-stack earnings that include capacity payments, and separate full-year receipts from monthly figures expressed at annualized rates. This prevents exceptional short-term trading performance from being mistaken for a dependable long-term return.
To understand why revenues declined, we compared deployment growth with changes in ancillary-service participation, energy arbitrage, electricity-price spreads, and weather-related scarcity events. We considered both growing battery competition and temporary market conditions, rather than attributing every revenue decline to saturation. California's Resource Adequacy arrangements and PJM's regulation-market redesign were assessed separately because their compensation mechanisms materially affect battery earnings.
Our investment calculations use explicitly stated illustrative assumptions, rather than claiming to reproduce the financial results of individual projects. The principal model applies a 15-year recovery period, a 10% required return, and $20/kW in annual recurring costs, producing a capital recovery factor of approximately 13.15%. We compare the calculated annual revenue requirements with observed market benchmarks while recognizing that taxes, subsidies, financing structures, degradation, replacements, and contractual conditions can change project economics.
We prioritize original electricity-market research, grid-operator publications, government data, battery cost studies, and company regulatory filings. Deployment data comes from the U.S. Energy Information Administration's battery capacity analysis and its 2026 generating-capacity outlook. ERCOT revenue trends are drawn from Modo Energy's analysis of 2025 Texas battery revenues, its ERCOT and CAISO revenue-stack comparison, and its research on ancillary-service saturation.
For California, key sources include Modo Energy's wholesale revenue analysis, its Resource Adequacy revenue research, the California Public Utilities Commission's Resource Adequacy documentation, and June 2026 battery revenue benchmarks. PJM comparisons draw on PJM's market-monitoring documentation and Modo Energy's post-redesign battery revenue analysis.
International comparisons use Modo Energy's Great Britain revenue analysis, the Australian Energy Market Operator's Quarterly Energy Dynamics reports, and AEMO's first-quarter 2026 market findings. Battery cost assumptions are informed by BloombergNEF's lithium-ion battery price survey. Equipment supplier economics are assessed using Tesla's 2025 Form 10-K and second-quarter 2026 Form 10-Q.
Our conclusions give greater weight to recurring revenue evidence, observable financial performance, and comparisons supported by multiple independent indicators than to isolated periods of exceptional earnings. The resulting assessment separates the long-term commercial need for grid storage from the investment returns available to particular projects, electricity markets, and equipment suppliers.

Our report covering the grid-scale battery storage market gets updated several times a month, so you always get the latest view of where things stand.
Written by the New Market Pitch teamWe track new markets so founders and investors can move faster. About us