What are the top FinTech startups by revenue today?
Whether you're building or investing in the fintech market, our report covers everything you need to know: the players, the money, and what's coming next.
Summary
Ant Group ranks first among FinTech startups by revenue today, with approximately $37B in estimated 2025 annual revenue. Nu Holdings follows at $15.8B, ahead of Oscar Health ($11.7B), Coinbase ($7.18B), and Stripe ($6.8B).
Ant Group's lead is enormous, but its $37B figure is an independent estimate rather than a recently audited disclosure. Nu Holdings is the highest-ranked FinTech startup with directly filed annual revenue evidence, making its $15.8B a firmer benchmark.
FinTech is already operating at institutional scale. Of the 48 companies ranked, 25 have selected financial measures above $1B and the first 16 exceed $2B. Those numbers include annual revenue, estimates, run-rates, and some alternative financial measures, so the ranking captures commercial scale rather than perfectly comparable sales.
Business models explain some surprising positions. Oscar Health outranks Coinbase and Stripe largely because insurance premiums generate an enormous top line, although medical claims consume much of that income. Banking revenue, payment fees, software subscriptions, and insurance premiums have very different economics.
Coinbase's $7.18B revenue exceeds Stripe's reported $6.8B by just $380M. Stripe nevertheless processed $1.9T in payments during 2025, illustrating how a financial platform can handle trillions of dollars while recognizing only a small fraction as its own revenue.
Digital banking has become a particularly large business. Nu Holdings generates roughly 2.65 times Revolut's revenue, but Revolut's 46% annual growth and 38% pre-tax profit margin show that smaller challengers can still combine aggressive expansion with substantial earnings.
Corporate spending and international payments are producing some of the fastest-growing FinTech companies. Ramp exceeded $2B in annualized revenue during 2026, while Airwallex reached a $1.3B run-rate after 74% year-over-year growth. Both are expanding well beyond their original payment products.
Not every billion-dollar revenue stream behaves like transaction fees. Circle earned roughly 96% of its $2.75B in FY2025 revenue and reserve income from stablecoin reserves, leaving its economics unusually sensitive to interest rates, reserve balances, and distribution arrangements.
FinTech's geographical reach is also wider than the US and Europe. Brazil's Nu Holdings, South Korea's Toss, India's Paytm, and Egypt's MNT-Halan demonstrate that digital finance can reach significant scale across very different markets, even when local customer spending and regulation differ sharply.
The ranking deliberately leaves out companies whose impressive figures measure money moving through their platforms rather than money earned. Tabby's $18B in annualized transaction volume, Moniepoint's roughly $269B in 2025 transaction volume, and Valon's $200B-plus mortgage servicing portfolio do not establish company revenue. The real competitive test now is how much of that activity FinTech companies can convert into profitable, durable income.

Written by the New Market Pitch teamWe track new markets so founders and investors can move faster. About us

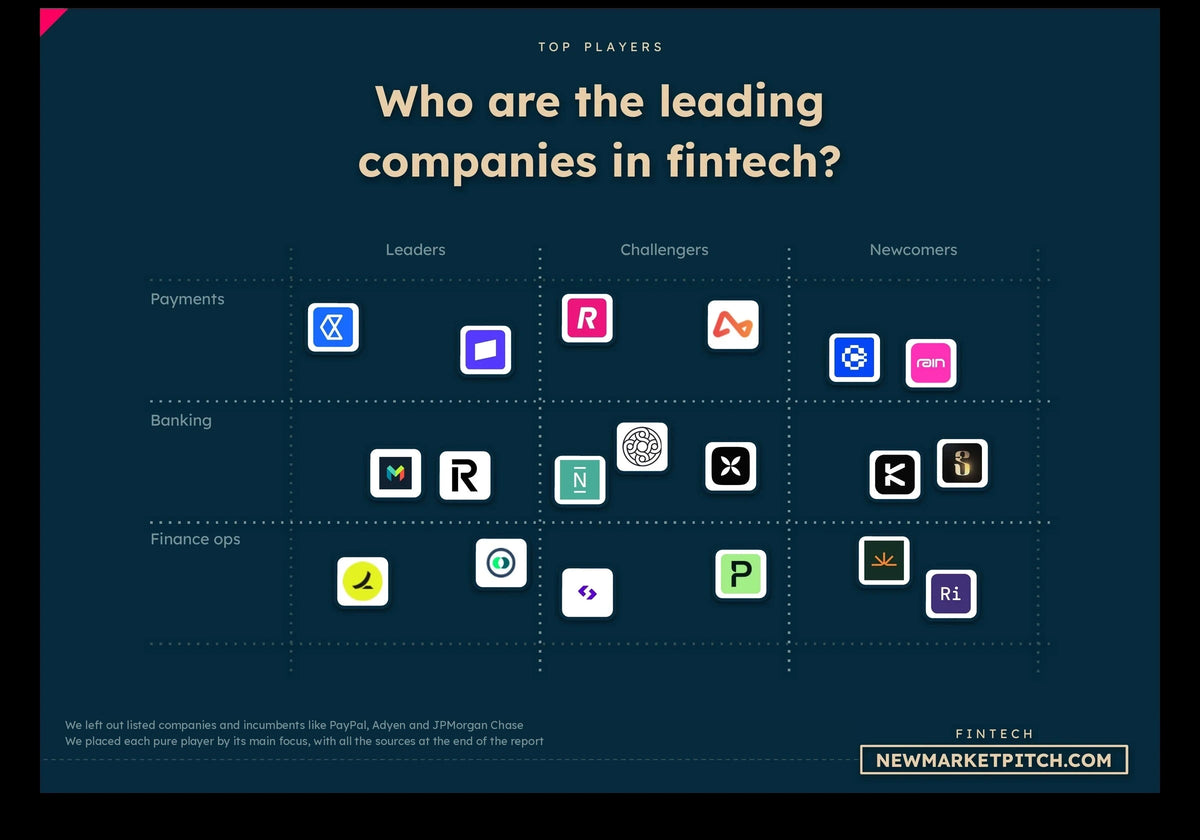
In our report covering the fintech market, we turn what is vague and complex into simple, useful visuals. Market maps like this one show you at a glance where every startup stands.
The ranking of top startups in the FinTech Market by revenue
Below is a table ranking the startups of this market by their current revenue scale. You can find our methodology at the end of this page.
If you want a deeper understanding of the market and its current dynamics, get our report on the FinTech market.
| Ranking | Company | Latest Metric | Metric Type | Freshness | Disclosed When | Source Quality | Confidence | Segment | Why This Ranking | Local Metric | Country |
|---|---|---|---|---|---|---|---|---|---|---|---|
| 1 | Ant Group | ~$37B | Estimated Annual Revenue | Fresh · 10mo | Oct 2026 | Third-Party Estimate | Low | Digital Payments & Financial Platforms | Leads the startups on revenue-scale evidence, well above Nu Holdings' $15.8B. The ~$37B is estimated, much larger than the 2019 prospectus, overlaps with subsidiary Ant International and differs from recognized annual revenue. | cn | |
| 2 | Nu Holdings | $15.8B | Fiscal-Year Revenue | Fresh · 10mo | Apr 2026 | Filed / Audited | High | Digital Banking | Below Ant Group's ~$37B estimate and above Oscar Health's $11.7B on audited revenue. The IFRS reported total differs from the managerial presentation revenue. | br | |
| 3 | Oscar Health | $11.7B | Fiscal-Year Revenue | Fresh · 10mo | Feb 13, 2026 | Filed / Audited | High | Digital Health Insurance | Fresh audited $11.7B revenue ranks below Nu Holdings' $15.8B and above Coinbase's $7.18B. Insurance premiums dominate revenue and include medical risk exposure. | us | |
| 4 | Coinbase | $7.18B | Fiscal-Year Revenue | Fresh · 10mo | Feb 2026 | Filed / Audited | High | Digital Asset Financial Infrastructure | Below Oscar Health, above Stripe on revenue-scale evidence. Financial-use digital asset exchange, not a crypto project without financial use. | us | |
| 5 | Stripe | $6.8B | Annual Revenue | Fresh · 10mo | Jul 22, 2026 | Credible Reported | Medium | Payments Infrastructure | Below Coinbase's $7.18B and above Toast's $6.15B. The $6.8B is a private-company figure attributed to a person familiar, not the $1.9T TPV, so source uncertainty lowers precision. | us | |
| 6 | Toast | $6.15B | Fiscal-Year Revenue | Fresh · 10mo | Feb 2026 | Filed / Audited | Medium | Restaurant Payments & Software | Below Stripe ($6.8B) and above Revolut (~$5.96B) on revenue-scale evidence. The $6.15B includes payment processing and nonfinancial restaurant management software. | us | |
| 7 | Revolut | ~$5.96B | Fiscal-Year Revenue | Fresh · 10mo | Mar 24, 2026 | Filed / Audited | High | Digital Banking | Below Toast on revenue-scale evidence; above Robinhood on revenue-scale evidence. Company also disclosed US$6.0B approximate conversion; GBP is reporting currency. | £4.5B | gb |
| 8 | Robinhood | $4.47B | Fiscal-Year Revenue | Fresh · 10mo | Feb 10, 2026 | Filed / Audited | High | Digital Brokerage | Below Revolut's ~$5.96B and just above Affirm's $4.26B on revenue scale. Net revenue covers brokerage and crypto-related financial activity. | us | |
| 9 | Affirm | $4.26B | Fiscal-Year Revenue | Very Fresh · 4mo | Aug 2026 | Filed / Audited | High | Buy Now Pay Later | Below Robinhood, above SoFi Technologies on revenue-scale evidence. Recognized network, interest, loan-sale and servicing revenues; not GMV. | us | |
| 10 | SoFi Technologies | $3.61B | Fiscal-Year Revenue | Fresh · 10mo | Feb 2026 | Filed / Audited | High | Digital Banking & Lending | Below Affirm ($4.26B) and above Klarna ($3.51B) on revenue-scale evidence. The newer Q3 2026 quarter is not substituted for the full year. | us | |
| 11 | Klarna | $3.51B | Fiscal-Year Revenue | Fresh · 10mo | Feb 26, 2026 | Filed / Audited | High | Buy Now Pay Later | Below SoFi Technologies on revenue-scale evidence; above Circle on revenue-scale evidence. Uses recognized revenue rather than GMV. | se | |
| 12 | Circle | $2.75B | Fiscal-Year Revenue | Fresh · 10mo | Feb 25, 2026 | Filed / Audited | Medium | Stablecoin Payment Infrastructure | Below Klarna's $3.51B and above Wise's $2.5B on revenue scale. Includes $2.637B reserve interest income; USDC token volume is not revenue. | us | |
| 13 | Wise | $2.5B | Fiscal-Year Revenue | Fresh · 7mo | Jun 25, 2026 | Company Disclosed | High | International Money Transfer | Below Circle, above Monzo on revenue-scale evidence. Net revenue includes card and interest, not cross-border transfer volume. | gb | |
| 14 | Monzo | ~$2.28B | Fiscal-Year Revenue | Fresh · 7mo | May 19, 2026 | Filed / Audited | High | Digital Banking | Below Wise ($2.5B) and above Chime ($2.19B) on revenue-scale evidence. The ~$2.28B covers banking interest income and product fees, converted from GBP. | £1.7B | gb |
| 15 | Chime | $2.19B | Fiscal-Year Revenue | Fresh · 10mo | Feb 2026 | Company Disclosed | High | Consumer Digital Banking | Below Monzo on revenue-scale evidence; above Ramp, whose >$2B is a run-rate. Recognized company revenue, not number of members. | us | |
| 16 | Ramp | >$2B | Revenue Run-Rate | Very Fresh · 0mo | Oct 15, 2026 | Company Disclosed | Medium | Corporate Cards & Expense Management | Below Chime's $2.19B and above Clover Health's $1.92B. Its >$2B is an annualized rate, not recognized FY revenue, and should not outrank substantial audited revenue merely by funding. | us | |
| 17 | Clover Health | $1.92B | Fiscal-Year Revenue | Fresh · 10mo | Feb 2026 | Filed / Audited | Medium | Technology-Led Health Insurance | Below Ramp, above Viva Republica (Toss) on revenue-scale evidence. Claims-heavy insurance revenue, not SaaS; technology-led payer at boundary of FinTech. | us | |
| 18 | Viva Republica (Toss) | ~$1.9B | Fiscal-Year Revenue | Fresh · 10mo | Mar 31, 2026 | Credible Reported | Medium | Finance Super-App & Payments | Just below Clover Health ($1.92B) and above Remitly ($1.6B) on revenue-scale evidence. The super-app includes advertising and nonfinancial commerce, so it is less pure fintech; source uncertainty lowers precision. | KRW 2.7T | kr |
| 19 | Remitly | $1.6B | Fiscal-Year Revenue | Fresh · 10mo | Feb 18, 2026 | Company Disclosed | High | Digital Remittances | Below Viva Republica (Toss) on revenue-scale evidence; above Airwallex, whose $1.3B is a run-rate. Company revenue, not dollars remitted. | us | |
| 20 | Airwallex | $1.3B | Revenue Run-Rate | Fresh · 7mo | Jun 25, 2026 | Company Disclosed | Medium | Global Payments & Financial Accounts | Below Remitly's $1.6B and just above Pagaya's $1.26B on revenue scale. Its $1.3B is annualized revenue, not FY revenue or the amount funded. | sg | |
| 21 | Pagaya | $1.26B | Annual Revenue | Fresh · 10mo | Feb 9, 2026 | Filed / Audited | High | AI Loan Origination Infrastructure | Below Airwallex on revenue-scale evidence; above Starling Bank on revenue-scale evidence. Revenue from fees only; excludes other investment income. | us | |
| 22 | Starling Bank | ~$1.19B | Fiscal-Year Revenue | Fresh · 7mo | May 21, 2026 | Company Disclosed | High | Digital Banking & BaaS | Below Pagaya on revenue-scale evidence; above FNZ on revenue-scale evidence. Revenue lower than prior year; latest period preferred. | £887M | gb |
| 23 | FNZ | $1.1B | Annual Operating Income | Fresh · 10mo | Sep 2026 | Credible Reported | Medium | Wealth-Management Infrastructure | Below Starling Bank on revenue-scale evidence; above DLocal on revenue-scale evidence. Operating income label is not necessarily ordinary recognized group revenue; 2026 asset sales change perimeter. Metric differs from recognized annual revenue. Source uncertainty lowers precision. | gb | |
| 24 | dLocal | $1.09B | Fiscal-Year Revenue | Fresh · 10mo | Mar 18, 2026 | Company Disclosed | High | Emerging-Market Payments | Below FNZ, above Payoneer on revenue-scale evidence. Direct revenue, not total payment volume. | uy | |
| 25 | Payoneer | $1.05B | Fiscal-Year Revenue | Fresh · 10mo | Feb 2026 | Filed / Audited | High | Cross-Border Business Payments | Below DLocal ($1.09B) and above Paytm (~$959M) on revenue-scale evidence. The $1.05B is direct revenue, not dollar payouts. | us | |
| 26 | Paytm | ~$959M | Fiscal-Year Revenue | Fresh · 7mo | May 7, 2026 | Company Disclosed | High | Indian Digital Payments | Below Payoneer on revenue-scale evidence; above eToro, whose $868M is net contribution. Original INR preserved; commerce/marketing adjacent services present. | INR 84.4B | in |
| 27 | eToro | $868M | Annual Net Contribution | Fresh · 10mo | Feb 17, 2026 | Company Disclosed | Medium | Digital Brokerage | Below Paytm's ~$959M and just above Trade Republic's ~$852M. Its $868M is non-GAAP net contribution, not GAAP top-line, so it cannot be directly equated to revenue. | il | |
| 28 | Trade Republic | ~$852M | Fiscal-Year Revenue | Fresh · 13mo | Oct 12, 2026 | Credible Reported | Medium | Technology-Led Brokerage | Below eToro, above OakNorth on revenue-scale evidence. Financial period ended 13 months before report and reported account not independently accessed; source uncertainty lowers precision. | €754M | de |
| 29 | OakNorth | ~$803M | Fiscal-Year Revenue | Fresh · 10mo | Mar 17, 2026 | Company Disclosed | High | SME Digital Lending | Below Trade Republic's ~$852M and above Checkout.com's $750M run-rate on revenue-scale evidence. Recognized banking revenue, GBP original. | £606M | gb |
| 30 | Checkout.com | $750M | Revenue Run-Rate | Very Fresh · 1mo | Sep 29, 2026 | Company Disclosed | Medium | Enterprise Payment Processing | Below OakNorth (~$803M) and above Brex (~$700M) on revenue-scale evidence. The $750M is annualised net revenue, not TTM recognized revenue or the forecast $480B payments volume. | gb | |
| 31 | Brex | ~$700M | Revenue Run-Rate | Fresh · 14mo | 2026 | Third-Party Estimate | Low | Corporate Spend & Cards | Below Checkout.com and above Mercury on revenue-scale evidence. Acquired by Capital One in 2026; pre-deal standalone run-rate uncertain. Metric differs from recognized annual revenue. Source uncertainty lowers precision. | us | |
| 32 | Mercury | $650M | Revenue Run-Rate | Fresh · 13mo | Nov 7, 2025 | Company Disclosed | Medium | Business Digital Banking | Below Brex's ~$700M estimate and above Marqeta's $625M recognized revenue. Uses the CEO's 2025 run-rate figure rather than Sacra's $1B September 2026 estimate; metric differs from recognized annual revenue. | us | |
| 33 | Marqeta | $625M | Fiscal-Year Revenue | Fresh · 10mo | Feb 24, 2026 | Company Disclosed | High | Card Issuing API | Below Mercury on revenue-scale evidence; above Flywire on revenue-scale evidence. Recognized processing revenue, not card processing volume. | us | |
| 34 | Flywire | $623M | Fiscal-Year Revenue | Fresh · 10mo | Feb 24, 2026 | Filed / Audited | High | Vertical Payments Infrastructure | Below Marqeta on revenue-scale evidence; above SumUp on revenue-scale evidence. Net revenue includes some ancillary service pass-through; company also reports revenue less ancillary. | us | |
| 35 | SumUp | ~$600M | Estimated Revenue Run-Rate | Fresh · 10mo | 2026 | Third-Party Estimate | Low | SMB Merchant Payments | Below Flywire, above Webull on revenue-scale evidence. Estimated run-rate, not company-disclosed ARR or recognized annual revenue, and excludes take-rate uncertainty; source uncertainty lowers precision. | gb | |
| 36 | Webull | $571M | Fiscal-Year Revenue | Fresh · 10mo | Mar 4, 2026 | Company Disclosed | Medium | Digital Brokerage | Below SumUp (~$600M estimate) and just above N26 (~$567M) on revenue-scale evidence. The $571M press-release figure differs from a financial aggregator's $564.3M 2025 presentation. | us | |
| 37 | N26 | ~$567M | Fiscal-Year Revenue | Fresh · 10mo | Jun 25, 2026 | Company Disclosed | High | Digital Banking | Below Webull on revenue-scale evidence; above Plaid on revenue-scale evidence. €501.6M revenue preferred over newer 2026 Q1 €130M partial-quarter figure. | €502M | de |
| 38 | Plaid | ~$546M | ARR | Fresh · 10mo | Apr 1, 2026 | Third-Party Estimate | Low | Open Banking APIs | Below N26 on revenue-scale evidence; above Zopa Bank on revenue-scale evidence. Unverified subscription ARR estimate, not reported annual revenue. Metric differs from recognized annual revenue. Source uncertainty lowers precision. | us | |
| 39 | Zopa Bank | ~$499M | Annual Revenue | Fresh · 10mo | Mar 19, 2026 | Company Disclosed | High | Digital Bank & Credit | Below Plaid on revenue-scale evidence; above Hippo on revenue-scale evidence. GBP banking revenue and loan income. | £377M | gb |
| 40 | Hippo | $469M | Fiscal-Year Revenue | Fresh · 10mo | Feb 2026 | Filed / Audited | Medium | Home Insurance Technology | Below Zopa Bank on revenue-scale evidence; above Alkami on revenue-scale evidence. Carrier premium revenue, not pure software commissions. | us | |
| 41 | Alkami | $444M | Fiscal-Year Revenue | Fresh · 10mo | Feb 25, 2026 | Company Disclosed | High | Digital Banking Software | Below Hippo's $469M and just above Razorpay's older ~$437M on revenue scale. Its $444M is bank SaaS revenue. | us | |
| 42 | Razorpay | ~$437M | Fiscal-Year Revenue | Aging · 19mo | Oct 16, 2025 | Credible Reported | Medium | Merchant Payments & Banking APIs | Below Alkami on revenue-scale evidence; above MNT-Halan on revenue-scale evidence. Operating year already 19 months old; newer volumes should not overwrite revenue. Source uncertainty lowers precision. | INR 37.8B | in |
| 43 | MNT-Halan | ~$410M | Adjusted Annual Revenue | Fresh · 10mo | Oct 2026 | Credible Reported | Medium | Digital Lending & Payments | Below Razorpay, above Nium on revenue-scale evidence. Adjusted group metric rather than unqualified GAAP revenue; local listing may be Egypt-only. Source uncertainty lowers precision. | EGP 20.5B | eg |
| 44 | Nium | $200M | ARR | Fresh · 7mo | Oct 20, 2026 | Company Disclosed | Medium | B2B Cross-Border Payments | Below MNT-Halan (~$410M) and above Mollie (~$166M) on revenue-scale evidence. The CFO says Nium passed $200M ARR earlier in 2026, but ARR for payment activity needs scrutiny and differs from recognized revenue. | sg | |
| 45 | Mollie | ~$166M | Annual Net Revenue (before interest) | Fresh · 10mo | May 20, 2026 | Company Disclosed | Medium | Merchant Payments Infrastructure | Below Nium on revenue-scale evidence; above Zilch on revenue-scale evidence. An older 2024 €214M gross revenue is less recent and not comparable with 2025 net figure. Metric differs from recognized annual revenue. | €147M | nl |
| 46 | Zilch | ~$146M | Annual Revenue | Fresh · 10mo | Feb 2026 | Filed / Audited | Low | Consumer BNPL & Rewards | Below Mollie on revenue-scale evidence; above Blend Labs on revenue-scale evidence. Historical FY2025 year ended March 2025; current 2026 scale may be larger. | £110M | gb |
| 47 | Blend Labs | $124M | Fiscal-Year Revenue | Fresh · 10mo | Mar 2026 | Filed / Audited | High | Mortgage Origination Software | Below Zilch on revenue-scale evidence; above Jeeves on revenue-scale evidence. Software platform revenue; unrelated mortgage volume excluded. | us | |
| 48 | Jeeves | $40M | Annual Revenue | Aging · 22mo | Dec 2025 | Third-Party Estimate | Low | Business Payments & Cards | Below Blend Labs on revenue-scale evidence. 2024 source reported $40M, unverified and old; 2026 round does not prove current revenue. Source uncertainty lowers precision. | us | |
| NR | Spiko | $2.7B | Assets Under Management | Very Fresh · 0mo | Oct 6, 2026 | Company Disclosed | Low | Tokenized Cash Management | Unranked: Financial assets managed, not issuer revenue. No defensible revenue-based position. | fr | |
| NR | Tabby | $18B | Annualized Transaction Volume | Very Fresh · 1mo | Sep 2026 | Company Disclosed | Low | Buy Now Pay Later | Unranked: Volume not revenue; cash flow through merchants cannot rank against fintech revenue. No defensible revenue-based position. | sa | |
| NR | Moniepoint | ~$269B | Annual Transaction Volume | Fresh · 10mo | Feb 2, 2026 | Credible Reported | Low | African Merchant Banking & Payments | Unranked: TechCabal's separate modeled revenue is explicitly excluded. No defensible revenue-based position. | NGN 412T | ng |
| NR | Savvy Wealth | >$9B | Assets Under Management | Very Fresh · 1mo | Sep 9, 2026 | Company Disclosed | Low | Technology-Led Wealth Management | Unranked: $100M ARR was a year-end target, not achieved current revenue; do not rank the forecast. No defensible revenue-based position. | us | |
| NR | Valon | >$200B | Mortgage Loans Serviced (UPB) | Very Fresh · 0mo | Oct 6, 2026 | Company Disclosed | Low | Mortgage Servicing Software | Unranked: Loan principal balance administered on platform is not company revenue or credit issued. No defensible revenue-based position. | us | |
| NR | Vesta | >$100B | Client Annual Mortgage Originations | Very Fresh · 0mo | Oct 8, 2026 | Company Disclosed | Low | Mortgage Origination Software | Unranked: Volume originated by lenders on or migrating to the software, not Vesta GMV or Vesta revenue. No defensible revenue-based position. | us |

Our research about fintech companies gets updated several times a month, so you always get the latest view of where things stand.
Which FinTech startups make the most revenue today?
Ant Group currently ranks first among FinTech startups by revenue, with approximately $37B in estimated 2025 annual revenue. Nu Holdings follows with $15.8B in FY2025 revenue, ahead of Oscar Health ($11.7B), Coinbase ($7.18B), and Stripe ($6.8B).
FinTech has grown into a market where digital banks, payment processors, insurers, and financial platforms can generate billions of dollars annually. The largest companies have moved well beyond their original products, often combining several financial services under one brand.
The ranking also shows how much the business model changes what revenue actually means. Oscar Health collects insurance premiums and pays medical claims. Coinbase earns money from digital-asset financial services. Stripe processes payments for businesses, while Nu Holdings earns revenue from banking products, lending, and other financial activities.
Among the 48 ranked startups, the first 25 have revenue figures or annualized financial measures above $1B. The first 16 exceed $2B. Those thresholds show how many FinTech companies have already reached significant commercial scale, even though their financial measures are not always directly comparable.
The table below presents the leading companies in ranking order. Estimates, run-rates, and reported fiscal-year revenue are kept distinct.
| Rank | FinTech startup | Revenue figure | Metric and period |
|---|---|---|---|
| 1 | Ant Group | ~$37B | Estimated annual revenue, 2025 |
| 2 | Nu Holdings | $15.8B | FY2025 revenue |
| 3 | Oscar Health | $11.7B | FY2025 revenue |
| 4 | Coinbase | $7.18B | FY2025 revenue |
| 5 | Stripe | $6.8B | Privately reported 2025 annual revenue |
| 6 | Toast | $6.15B | FY2025 revenue |
| 7 | Revolut | £4.5B (~$5.96B) | FY2025 revenue |
| 8 | Robinhood | $4.47B | FY2025 revenue |
| 9 | Affirm | $4.26B | FY2026 revenue |
| 10 | SoFi Technologies | $3.61B | FY2025 revenue |
| 11 | Klarna | $3.51B | FY2025 revenue |
| 12 | Circle | $2.75B | FY2025 revenue and reserve income |
| 13 | Wise | $2.5B | FY2026 revenue |
| 14 | Monzo | £1.7B (~$2.28B) | FY2026 revenue |
| 15 | Chime | $2.19B | FY2025 revenue |
| 16 | Ramp | >$2B | October 2026 annualized revenue run-rate |
How much revenue does Ant Group make today?
Ant Group is the highest-ranked FinTech startup, generating approximately $37B in estimated annual revenue for 2025, although the figure comes from independent analysis rather than a recent audited financial statement.
Sacra estimates Ant Group's 2025 revenue at approximately $37B, including around $3.7B attributable to Ant International. The estimate is substantially higher than the $17.5B in annual revenue disclosed in Ant Group's historical IPO materials for 2019.
The company's scale comes from far more than Alipay's payment functions. Ant Group has built businesses around digital payments, financial technology services, consumer credit, wealth management, and international financial infrastructure.
The regulatory changes that began in China in late 2020 reshaped that business. Restrictions on consumer lending reduced the scope of an activity that had previously generated substantial revenue. Meanwhile, Ant International expanded from less than $1B in revenue in 2019 to approximately $3.7B in 2025, according to Sacra.
Ant International's expansion helps explain the group's continued scale, but its revenue cannot be added again to the consolidated estimate without counting it twice. The approximately $37B figure supports Ant Group's first position, although its precision remains less certain than the audited figures reported by publicly listed companies.

In our market report about fintech companies, we look at what the winners do differently, so you can learn from the best instead of guessing.
Is Nu Holdings the biggest digital banking startup?
Nu Holdings is currently the highest-ranked digital banking startup by revenue, reporting $15.8B for FY2025, far ahead of Revolut, SoFi Technologies, Monzo, and Chime.
The company behind Nubank has grown from a Brazilian credit-card challenger into a financial platform operating across Latin America. Its products now cover deposits, cards, lending, payments, and other everyday banking services.
Nu Holdings' FY2025 consolidated financial statements report $15.8B in revenue under IFRS. We use that statement-based amount rather than the company's alternative managerial revenue presentation.
The scale gap is already substantial. Nu Holdings generated approximately 2.65 times Revolut's reported revenue equivalent of $5.96B and more than four times SoFi Technologies' $3.61B. Among digital banks in the ranking, the differences are measured in billions rather than millions.
The economics are more complicated than those of software subscriptions. Lending generates interest income but also requires funding and exposes a bank to credit losses. Higher revenue doesn't necessarily mean proportionately higher profits.
Still, Nu Holdings' position is clear. With a directly filed FY2025 revenue figure of $15.8B, it has reached a level of financial scale that most digital banking challengers have yet to approach.
Why does Oscar Health make more revenue than so many FinTech companies?
Oscar Health ranks third among FinTech startups with $11.7B in FY2025 revenue because health insurance generates substantial premium income, even when the insurer operates through a technology-led business model.
The company's FY2025 SEC filing shows that insurance activities account for most of its revenue. Policyholder premiums create a large top line, but Oscar Health also bears the cost of medical claims and other insurance obligations.
An insurer may collect billions in premiums while spending a large share of that money on healthcare services for its members. Its revenue therefore works differently from the fees collected by payment software providers.
Clover Health offers a similar example lower in the ranking. It generated $1.92B in FY2025 revenue and ranks 17th. Both companies use technology in insurance markets, but their financial performance depends heavily on claims costs and the economics of providing coverage.
Oscar Health's position ahead of Coinbase and Stripe is legitimate under our revenue ranking. It says little by itself about their relative profitability.

In our document detailing everything you need to know about fintech, you will always find fresh funding data, taken straight from our own verified funding database.
Is Coinbase bigger than Stripe by revenue, and how much does Stripe actually make?
Coinbase currently ranks ahead of Stripe by revenue, with $7.18B in FY2025 revenue compared with Stripe's $6.8B in privately reported 2025 annual revenue.
Coinbase's figure comes from its annual financial statements. Stripe's figure was reported by The Information in July 2026, citing a person familiar with the company's finances.
The difference is approximately $380M, equivalent to about 5.6% of Stripe's revenue figure. Coinbase is ahead in our ranking, although the gap is relatively narrow considering the difference between a filed result and private-company reporting.
The two companies make money in quite different ways. Coinbase's trading and digital-asset services are exposed to cryptocurrency prices, trading volumes, and market activity. Stripe earns revenue by providing payment processing and financial infrastructure to businesses.
Stripe's commercial footprint is enormous. Its 2025 total payment volume reached $1.9T, but that figure measures money processed on its infrastructure rather than revenue earned. Comparing it with Stripe's reported $6.8B revenue gives a ratio of approximately 0.36%. This is only a scale calculation, since Stripe also earns money from other products and the two measures do not necessarily cover identical activities.
Stripe now sells much more than online payment acceptance. Its platform includes subscription billing, tax tools, identity verification, and financial products for businesses and software platforms. These services allow Stripe to earn revenue beyond the fees charged on individual card transactions.
The company's $6.8B also places it above Toast's $6.15B and well ahead of Checkout.com's $750M September 2026 annualized net revenue run-rate. The figures aren't directly interchangeable, but the size gap is striking.
Coinbase retains the higher revenue position today. Stripe, meanwhile, has built a major financial technology business whose revenue increasingly extends beyond its original payment-processing service.
Is Revolut catching up with Nu Holdings?
Revolut is growing quickly, but Nu Holdings still generates roughly 2.65 times as much revenue. Revolut reported £4.5B in FY2025 revenue, approximately $5.96B, compared with Nu Holdings' $15.8B.
Revolut's 2025 annual report shows revenue rising 46% from £3.1B in 2024 to £4.5B. Profit before tax increased 57% to £1.7B, giving the company a 38% pre-tax profit margin.
That's an impressive combination of growth and profitability. Revolut has expanded across consumer banking, international transfers, investing, subscriptions, and business accounts, with 11 product lines generating more than £100M each in 2025.
Customer balances also rose 66%, from £30.2B to £50.2B, according to its annual report. Customers are increasingly keeping substantial financial balances within the Revolut ecosystem.
Nu Holdings remains much larger on reported revenue, partly because its Latin American banking operations include significant lending and financial income. Revolut's growth, meanwhile, shows how a European challenger can build a broad financial platform across multiple products and countries.
The gap is still too large to describe the companies as equal in revenue. Revolut is catching up in absolute business scale, but Nu Holdings remains comfortably ahead.

Learning from others' mistakes is the cheapest lesson there is. In our report covering the fintech market, we look at what broke startups before you, so you don't repeat it.
Are payment startups making more money than digital banks?
Digital banks and payment startups both generate billions in revenue today, although the largest financial platforms increasingly combine banking, payments, lending, and other services.
Nu Holdings is the clearest large-scale digital banking example, with $15.8B in FY2025 revenue. Stripe generated $6.8B in reported annual revenue, while Toast reported $6.15B from restaurant payments and software.
Revolut generated £4.5B through its diversified financial platform. SoFi Technologies reported $3.61B from its banking and lending activities. Wise produced $2.5B in FY2026 revenue from international transfers and related financial products.
The biggest difference between these models is how they earn and retain money. A payment processor collects fees on transactions. A bank may earn fees and interest, while assuming additional credit, funding, and regulatory obligations.
Toast offers an interesting middle ground. Its payments business is closely integrated with restaurant software, giving the company more opportunities to charge customers for services beyond payment acceptance.
It's easy to see why diversified financial platforms occupy so many high positions. Once a company becomes a regular part of how customers manage money, it can add services around that relationship.
Neither model wins across the whole market. Both payment infrastructure and digital banking already support multibillion-dollar businesses, but their margins and risks can differ considerably.
Which FinTech startups make more than $1 billion a year?
Twenty-five FinTech startups currently have ranked financial measures above $1B, although some report annualized revenue, estimated revenue, or alternative income measures rather than completed annual sales.
The first group includes companies with billions in reported revenue, such as Coinbase, Toast, Robinhood, Affirm, and Klarna.
Further down, Wise reported $2.5B in FY2026 revenue, Monzo generated £1.7B, approximately $2.28B, and Chime reported $2.19B in FY2025.
Ramp crossed $2B in annualized revenue, while Clover Health recorded $1.92B in FY2025 revenue. Viva Republica, the company behind Toss, reported KRW 2.7T, approximately $1.9B.
Remitly, Airwallex, Pagaya, Starling Bank, FNZ, dLocal, and Payoneer complete the group of ranked startups whose selected financial figures exceed $1B.
Ramp and Airwallex have annualized run-rate figures, while FNZ's $1.1B is reported operating income. These are useful measures of commercial scale, but they should not be confused with completed annual revenue.
| Rank | FinTech startup | Revenue figure | Metric and period |
|---|---|---|---|
| 17 | Clover Health | $1.92B | FY2025 revenue |
| 18 | Viva Republica (Toss) | KRW 2.7T (~$1.9B) | FY2025 revenue |
| 19 | Remitly | $1.6B | FY2025 revenue |
| 20 | Airwallex | $1.3B | March 2026 annualized revenue run-rate |
| 21 | Pagaya | $1.26B | FY2025 revenue |
| 22 | Starling Bank | £887M (~$1.19B) | FY2026 revenue |
| 23 | FNZ | $1.1B | FY2025 operating income |
| 24 | dLocal | $1.09B | FY2025 revenue |
| 25 | Payoneer | $1.05B | FY2025 revenue |
| 26 | Paytm | INR 84.4B (~$959M) | FY2026 revenue |
| 27 | eToro | $868M | FY2025 net contribution |
| 28 | Trade Republic | €754M (~$852M) | FY2025 revenue |
| 29 | OakNorth | £606M (~$803M) | FY2025 revenue |
| 30 | Checkout.com | $750M | September 2026 annualized net revenue run-rate |
| 31 | Brex | ~$700M | August 2025 estimated revenue run-rate |
| 32 | Mercury | $650M | September 2025 revenue run-rate |

Your time is limited. In our research about fintech companies, we put numbers on each part of the market, so you can see where it makes sense to focus.
Is Affirm bigger than Klarna now?
Affirm ranks ahead of Klarna by revenue, reporting $4.26B for FY2026 compared with Klarna's $3.51B for FY2025.
Both companies specialize in buy now, pay later financing, allowing consumers to spread payments over time while merchants receive payment services and access to additional customers.
Affirm's FY2026 financial statements include revenue from network activity, interest, loan sales, and servicing. Klarna's 2025 results show revenue increasing 25%, alongside 22% growth in gross merchandise volume to $127.9B.
Klarna's payment volume was more than 36 times its recognized revenue. A huge amount of money can move through a financing platform without becoming income for the platform itself.
Klarna also reported $65M in adjusted operating profit for 2025, representing an adjusted operating margin of approximately 1.9%. That's modest relative to revenue, especially for a business handling more than $100B in annual merchandise volume.
Affirm's revenue lead is clear within the ranking, although the figures cover different fiscal years.
Is Ramp the biggest corporate spending FinTech startup?
Ramp is currently the highest-ranked corporate spending FinTech startup, with more than $2B in annualized revenue, ahead of Brex and Mercury.
Ramp confirmed the milestone in an October 2026 announcement. Its co-founders said the business had passed $2B in annualized revenue during the summer and was generating positive cash flow.
The company also reported more than 85,000 business customers and over $275B in annualized purchase volume, up 175% year over year.
Sacra estimates that Ramp ended 2025 with approximately $1.225B in annualized revenue. Comparing that figure with the latest milestone gives an increase of at least $775M, or more than 63%. This is a calculation based on annualized figures at different points in time, rather than growth in completed fiscal-year revenue.
There is another useful detail in the customer data. Ramp reported 50,000 customers at the beginning of 2026, around 70,000 in early June, and more than 85,000 by October. That represents at least 70% customer growth from the beginning of the year, alongside expansion into larger business accounts.
Its newer products include accounts receivable, bill payments, procurement, travel, and financial automation. According to Ramp's October announcement, most customers now use at least two products, and a quarter use three or more.
Brex, acquired by Capital One in 2026, ranks 31st with approximately $700M in estimated August 2025 annualized revenue. Mercury follows at 32nd with a $650M September 2025 run-rate.
Ramp's lead within corporate spending is substantial. Its combination of customer growth, broader products, and positive cash flow puts it in a particularly strong position.

In our market report about fintech companies, we always try to gather several sources and make estimates that make sense, so you can work with solid numbers.
Which FinTech startups make the most money from international payments?
Wise, Remitly, Airwallex, dLocal, Payoneer, Checkout.com, and Nium are among the largest ranked FinTech startups specializing in international payments, cross-border transfers, and related financial infrastructure.
These businesses overlap, but they serve different customers. Wise focuses heavily on international money movement. Remitly serves consumers sending money across borders. Airwallex provides global accounts, payments, cards, and financial services for businesses.
Wise reported $2.5B in FY2026 revenue, ahead of Remitly's $1.6B in FY2025. Airwallex reached a $1.3B annualized revenue run-rate in March 2026, while dLocal generated $1.09B in FY2025.
Airwallex's growth deserves closer attention. The company reported 74% year-over-year growth in annualized revenue and more than 120% growth in annualized transaction volume, reaching $287B.
Revenue and transaction volume grew at noticeably different rates. Although the two disclosures do not establish a precise change in take rate, they show why processed payments cannot be treated as revenue.
Airwallex also stated that more than 90% of its revenue came from customers using multiple products. A large part of its business now depends on broader financial relationships rather than one payment service.
Payoneer reported $1.05B in FY2025 revenue. Checkout.com disclosed a $750M September 2026 annualized net revenue run-rate, and Nium reported $200M ARR earlier in 2026.
Consumer remittances, merchant payments, global business accounts, and financial APIs have each produced sizable companies, with different customers and pricing models.
How much revenue do Robinhood and other investing apps make?
Robinhood is the highest-ranked digital brokerage startup, with $4.47B in FY2025 revenue, while eToro, Trade Republic, and Webull have also built substantial financial businesses.
Robinhood earns money from brokerage, cryptocurrency-related services, and other financial activities. Its revenue scale shows how much a consumer investing platform can generate even after commission-free stock trading became widespread.
eToro ranks 27th with $868M in FY2025 net contribution. Trade Republic follows with €754M, approximately $852M, in FY2025 revenue, while Webull ranks 36th with $571M in FY2025 revenue.
The accounting differences are important here. eToro's net contribution is a non-GAAP measure, so it cannot be compared directly with ordinary revenue. Trade Republic's figure comes from annual accounts reported by Handelsblatt, while Webull's comes from its company financial disclosures.
These companies have also expanded beyond basic stock brokerage. Depending on the platform, customers can access cash accounts, investment products, cryptocurrency services, and other ways of managing financial assets.
Robinhood's revenue lead is substantial, although brokerage income remains sensitive to trading activity, market conditions, and interest rates.

If you build or invest in the fintech market, you need to know which business models pay off now and which ones are fading. That's why our report covering it has a whole section on it.
How does Circle make billions from stablecoins?
Circle ranks 12th among FinTech startups with $2.75B in FY2025 revenue and reserve income, with approximately 96% of that figure coming from interest earned on stablecoin reserves.
Circle's financial reporting shows $2.637B in reserve income. The company operates the USDC stablecoin ecosystem, where customers hold dollar-linked digital tokens backed by reserve assets.
Circle earns substantial income from those reserves. The value of tokens transferred on blockchains is a separate measure of activity and cannot be treated as the company's revenue.
Its FY2025 results reported $75.3B in USDC circulation at year-end, up 72%. Fourth-quarter on-chain transaction volume reached $11.9T, increasing 247% year over year.
USDC circulation gives an indication of the monetary base supporting the business, while transaction volume measures how frequently tokens are being used. Circle's financial performance therefore depends heavily on reserve balances, interest rates, and distribution arrangements.
Are European FinTech startups catching up with US companies?
European FinTech startups are already generating billions in revenue, led by Revolut, Wise, Monzo, and several specialist banking and payment businesses, although their scale varies considerably across the market.
Monzo provides one of the clearest examples of growth. Its FY2026 annual report shows revenue rising from £154.2M in FY2022 to £1.7B in FY2026, roughly eleven times the starting amount over four fiscal years.
Customer deposits rose from £16.6B in FY2025 to £25.7B in FY2026, a 55% increase. Monthly active users reached 10.4 million, and Monzo reported that 49% of them used the service as their primary bank.
Those details tell us more than revenue alone. More customers are holding balances and using Monzo for regular financial activity, giving the bank opportunities to earn income across a wider range of products.
Starling Bank shows a different pattern. It reported £887M in FY2026 revenue, below the previous year's £940M. The company remained profitable, with £217M in profit before tax, while continuing to develop its banking technology business.
Trade Republic reported €754M in revenue for its FY2025 period, OakNorth generated £606M in FY2025, and N26 reported €502M for the same year.
European FinTech has serious commercial depth today. But Monzo's rapid growth and Starling's revenue decline also show how differently individual companies are performing.

Theory only gets you so far. In our report covering the fintech market, we dig up the real signals from the field and show you the ones worth watching.
Which FinTech startups are growing the fastest right now?
Ramp and Airwallex stand out for rapid recent revenue run-rate growth, while Revolut, Monzo, and Klarna provide strong examples of growth in reported annual revenue.
Ramp's annualized revenue exceeded $2B in 2026 after Sacra estimated approximately $1.225B at the end of 2025. That represents growth of more than 63% between the selected measurement points.
Airwallex reported 74% year-over-year growth in annualized revenue when it reached $1.3B in March 2026.
Among companies with full-year revenue disclosures, Revolut increased revenue 46% in FY2025 to £4.5B. Monzo reported 39% growth in FY2026 to £1.7B, and Klarna recorded 25% growth in FY2025 to $3.51B.
The percentage alone doesn't settle which business is growing most impressively. Revolut added approximately £1.4B in annual revenue between 2024 and 2025, a much larger absolute increase than many smaller FinTech companies can achieve even with higher growth percentages.
The measures also differ. Ramp and Airwallex report annualized revenue at particular points in time, whereas Revolut, Monzo, and Klarna report completed financial periods.
Several already-large FinTech businesses are still growing quickly. Much of that expansion now comes from selling more financial products to existing customers, alongside adding new ones.
Are the biggest FinTech startups profitable yet?
Some of the largest FinTech startups are already profitable, with Revolut, Monzo, and Starling Bank providing clear recent examples, although profitability varies greatly between business models.
Revolut's FY2025 annual report disclosed £1.7B in profit before tax on £4.5B in revenue. That represents a 38% pre-tax margin, an unusually strong result for a fast-growing consumer and business financial platform.
Monzo reported £172.6M in adjusted profit before tax for FY2026, alongside £1.7B in revenue. Its adjusted pre-tax margin was approximately 10%, though the adjusted figure should not be confused with statutory net profit.
Starling Bank reported £217M in FY2026 profit before tax against £887M in revenue. That works out to approximately 24% on a simple pre-tax profit-to-revenue calculation.
Digital financial businesses can clearly reach substantial revenue while also earning significant profits. The question is how consistently they can maintain those earnings as they expand.
Profit from lending depends partly on credit quality and funding costs. Payment businesses face processing expenses and competition over merchant fees. Insurers must pay claims, while stablecoin issuers depend heavily on reserve income.
A revenue ranking tells us who has achieved the greatest commercial scale. Profitability needs its own evidence, and recent financial reports show that some FinTech startups are considerably further along than others.

In our research about fintech companies, we don't want to repeat what boring consulting reports say. Instead, we show you the real and latest market signals that matter.
How much revenue do India's biggest FinTech startups generate?
Paytm is the highest-ranked Indian FinTech startup, reporting INR 84.4B in FY2026 revenue, approximately $959M, while Razorpay ranks 42nd with INR 37.8B, approximately $437M, for FY2025.
Paytm's business spans merchant payments, financial services, and adjacent commercial activities. Its FY2026 financial results show that a major Indian digital payments business can approach $1B in recognized revenue.
Razorpay concentrates more heavily on payment infrastructure and financial technology for businesses. Its FY2025 revenue figure was reported by Moneycontrol from Indian financial accounts.
The difference between them reflects both business scope and reporting period. Paytm's selected financial year is more recent, while Razorpay's figure covers an earlier year.
India's digital payments market is famous for large transaction counts, particularly through UPI. However, large transaction numbers do not automatically produce equally large company revenue, especially where consumer payment services have very low direct pricing.
Are FinTech startups in emerging markets making billions?
FinTech startups serving emerging markets are already generating billions in revenue, with Nu Holdings, Viva Republica (Toss), dLocal, Payoneer, Paytm, and MNT-Halan showing how different financial services can reach substantial scale.
Nu Holdings' $15.8B in FY2025 revenue is the clearest large-scale example in Latin America.
Viva Republica, the South Korean company behind Toss, reported KRW 2.7T, approximately $1.9B, in FY2025 revenue. Reporting based on consolidated accounts shows how the company has expanded from its original money-transfer product into a broader financial super-app.
dLocal generated $1.09B in FY2025 revenue, serving payment needs in emerging markets. Payoneer reported $1.05B from cross-border business financial services, while Paytm's INR 84.4B in FY2026 revenue shows the scale already reached in India.
MNT-Halan adds another perspective. The Egyptian financial technology business reported EGP 20.5B, approximately $410M, in FY2025 adjusted annual revenue. The adjusted nature of the figure makes it less directly comparable with conventional reported revenue.
The companies address quite different needs: access to banking, merchant payment acceptance, international financial transfers, consumer lending, and broader financial services.
Their results show that financial technology is producing substantial businesses across several regions. How much revenue they can capture still depends on local income levels, financial regulation, credit conditions, and pricing.

In our market report about fintech companies, we like to show you the big picture. We know your time is precious, so we make every page quick to read and packed with as much learning as possible per minute.
Which smaller FinTech startups have the most revenue?
Mercury, Marqeta, Flywire, SumUp, Webull, N26, and Plaid are among the highest-ranked FinTech startups below the billion-dollar group, with financial figures ranging from approximately $546M to $650M.
Mercury ranks 32nd with a $650M revenue run-rate for September 2025. Marqeta follows with $625M in FY2025 recognized revenue, narrowly ahead of Flywire at $623M.
SumUp's approximately $600M is a third-party estimated run-rate rather than directly reported annual revenue. Webull reported $571M in FY2025, while N26 generated €502M, approximately $567M.
Plaid's approximately $546M is an estimated ARR figure for 2025, based on Sacra's analysis. Zopa Bank reported £377M, approximately $499M, in annual revenue.
Several smaller firms have particularly specialized businesses. Alkami sells digital banking software, Razorpay provides merchant payment infrastructure, and Blend Labs serves mortgage origination workflows.
The following table covers every remaining ranked startup in order, including the companies whose financial figures are smaller or less directly comparable.
| Rank | FinTech startup | Revenue figure | Metric and period |
|---|---|---|---|
| 33 | Marqeta | $625M | FY2025 revenue |
| 34 | Flywire | $623M | FY2025 revenue |
| 35 | SumUp | ~$600M | Estimated 2025 revenue run-rate |
| 36 | Webull | $571M | FY2025 revenue |
| 37 | N26 | €502M (~$567M) | FY2025 revenue |
| 38 | Plaid | ~$546M | Estimated 2025 ARR |
| 39 | Zopa Bank | £377M (~$499M) | 2025 annual revenue |
| 40 | Hippo | $469M | FY2025 revenue |
| 41 | Alkami | $444M | FY2025 revenue |
| 42 | Razorpay | INR 37.8B (~$437M) | FY2025 revenue |
| 43 | MNT-Halan | EGP 20.5B (~$410M) | FY2025 adjusted annual revenue |
| 44 | Nium | $200M | Early 2026 ARR |
| 45 | Mollie | €147M (~$166M) | FY2025 net revenue before interest |
| 46 | Zilch | £110M (~$146M) | FY2025 revenue |
| 47 | Blend Labs | $124M | FY2025 revenue |
| 48 | Jeeves | $40M | FY2024 annual revenue estimate |
Why aren't Tabby, Moniepoint, and other famous FinTech startups ranked by revenue?
Tabby, Moniepoint, Spiko, Savvy Wealth, Valon, and Vesta remain unranked because their strongest selected disclosures describe commercial activity or assets rather than comparable company revenue.
Tabby reported $18B in annualized transaction volume, while Moniepoint's 2025 transaction volume reached NGN 412T, approximately $269B, according to TechCabal.
Those are substantial figures, but the money largely belongs to merchants, customers, or other parties using the financial platforms.
Spiko reported $2.7B in assets under management as of October 2026. Savvy Wealth disclosed more than $9B under management. Valon reported servicing more than $200B in mortgage principal, while Vesta described more than $100B in annual mortgage originations associated with its clients.
None of these amounts establishes how much the companies themselves earned.
Savvy Wealth also communicated a $100M ARR target, but a planned future revenue level cannot be treated as an achieved result.
The distinction is particularly important in FinTech because businesses often process, administer, or safeguard amounts vastly larger than their own revenue.
We keep these companies visible as important participants in the market without assigning them a revenue position that the available evidence cannot support.

When you build or invest in the fintech market, you need clarity, not confusion. In our document detailing everything you need to know about fintech, we always try to put numbers on and quantify whatever is usually vague and confusing.
What are the top FinTech startups by revenue today?
Ant Group leads the FinTech startup revenue ranking with approximately $37B in estimated 2025 annual revenue, followed by Nu Holdings ($15.8B), Oscar Health ($11.7B), Coinbase ($7.18B), and Stripe ($6.8B).
Toast, Revolut, Robinhood, Affirm, and SoFi Technologies complete the top ten. Their businesses cover restaurant payments, digital banking, brokerage, installment financing, and consumer financial services.
The leading FinTech startups have reached the financial scale of major institutions. Twenty-five ranked companies have revenue or annualized financial measures above $1B, and the largest have moved well beyond their original products.
But the biggest numbers don't always represent the same economic achievement. Insurance premiums, banking interest, payment-processing revenue, trading income, and software subscriptions carry different costs and risks. Ant Group's leading estimate also has more uncertainty than the filed revenue figures immediately below it.
Recent results show that growth remains strong in parts of the industry. Ramp has exceeded $2B in annualized revenue, Revolut reported 46% annual revenue growth, and Monzo's revenue reached £1.7B after years of rapid expansion. Established revenue streams are increasingly complemented by newer products that encourage customers to use the same financial platform more frequently.
Ant Group holds the top position today, while Nu Holdings is the highest-ranked startup with directly filed annual revenue evidence. FinTech has already produced dozens of substantial businesses across banking, payments, lending, insurance, and financial infrastructure.
The next challenge is keeping growth under control without sacrificing credit quality, margins, or profitability. That's what will separate today's biggest FinTech startups from the companies that continue leading the market over the next few years.
Our methodology
We ranked FinTech startups by their latest credible revenue and commercial income figures, using financial reporting available as of November 2026. The analysis covers 48 ranked companies across digital banking, payments, lending, financial infrastructure, brokerage, insurance, and related financial technology businesses.
Our selection focuses on financial technology companies founded in 2000 or later, including privately held businesses and companies that first entered public markets in 2021 or later. Recently acquired startups remain eligible when their standalone financial figures can still be identified, as with Brex following its acquisition by Capital One. Older financial institutions and established corporate divisions are excluded.
We examined financial evidence from the preceding ten years, prioritizing audited accounts, regulatory filings, annual reports, investor presentations, official financial announcements, reputable financial journalism, and specialist private-company estimates. When several figures were available for the same business, we selected the measure that best reflected its current commercial scale, considering its reporting period, relevance, and source quality.
The ranking retains the original financial metric for each company. Fiscal-year revenue, ARR, annualized revenue run-rates, estimated revenue, operating income, and net contribution are identified separately. These figures are not always directly comparable, particularly between banks, insurers, payment processors, and software businesses. Transaction volumes, assets under management, mortgage principal, and other operating measures were considered for context but were not converted into hypothetical revenue figures.
We also checked whether financial disclosures covered an entire company or only part of its operations. Ant Group's estimated $37B is treated as a consolidated figure that already includes Ant International. Stripe's payment volume is kept separate from its privately reported revenue, and Circle's reserve income is distinguished from the value of USDC transactions. Currency conversions are approximate and are used to make companies easier to compare while retaining their original reported amounts.
Key sources include Sacra's Ant Group estimates, Nu Holdings' FY2025 financial statements, Oscar Health's FY2025 Form 10-K, Coinbase's annual report, The Information's reporting on Stripe, Toast's FY2025 filing, Revolut's 2025 annual report, Robinhood's annual filing, Affirm's FY2026 filing, and Klarna's FY2025 filing.
Additional sources include Circle's FY2025 results, Wise's FY2026 results, Monzo's 2026 annual report, Ramp's October 2026 announcement, Airwallex's financial and operating update, Starling Bank's FY2026 results, dLocal's FY2025 results, Paytm's FY2026 results, N26's FY2025 results, Moneycontrol's reporting on Razorpay, and Sacra's Brex estimates.

A good product starts with a real problem. In our report covering the fintech market, we show you the ones customers still live with.
Written by the New Market Pitch teamWe track new markets so founders and investors can move faster. About us